
September 30, 2026
BY: Gabriel Capella
Research Associate
Key Takeaways
- Active Contraction Observed: Puerto Rico’s Economic Activity Index (EAI) registered its third consecutive quarter of negative growth in Q2 2026.
- Structural Stagnation, Not Just a Cyclical Recession: While this downturn has been interpreted as a standard cyclical recession, that view is incomplete. Because economic activity has actually been flat since late 2023, this downturn represents a prolonged period of stagnation tipping into more definitive contraction and potentially the continuation of the structural decline of the last two decades.
- The Cost of Stagnation: The post-2023 economic flattening has created a massive gap in prosperity. Had the pre-2024 growth path been sustained, the EAI would stand roughly 8% higher today.
- Weak Growth Projections: Because the EAI and real gross national product (GNP) tend to move together, weak fiscal year (FY) 2026 growth in the EAI suggests similarly weak real GNP growth. The Puerto Rico Planning Board projects FY 2026 real GNP growth ranging from 0.4% in its baseline scenario to −1.6% in its pessimistic scenario.
- Delayed Recovery: This multi-year stagnation pushes a return to the economy’s historical June 2005 peak further into the future. Even if steady growth resumed today, recovery would take until 2035.
This blog analyzes the latest macroeconomic data to answer two key questions of public interest: first, whether Puerto Rico is in a recession, and second, whether this slowdown is due to a cyclical downturn or structural stagnation.
What is a recession?
Globally, the general rule of thumb is that an economy has entered a recession when real gross domestic product—in Puerto Rico’s case gross national product (GNP)—registers two consecutive quarters of negative growth.
What does Puerto Rico’s latest macroeconomic data show?
The Economic Activity Index (EAI), which gauges the state of the economy as a proxy for real GNP, registered its third consecutive quarter of negative growth in Q2 2026.
Does this mean that Puerto Rico is in a recession?
Accepting the general rule of thumb as legitimate, then we can say that Puerto Rico’s economy is confronting a recession. This answer, however, focuses on short-term economic cycles and assumes that Puerto Rico’s economy was growing, only to be interrupted by a temporary downturn.
Was Puerto Rico’s economy growing before late 2025?
A deep analysis of the EAI’s movement in recent years reveals that Puerto Rico’s economic activity has been stagnant since late 2023. So, in this sense, the quarterly downturn being observed could indicate a transition from a phase of stagnation to one of active contraction, rather than simply a cyclical recession. Therefore, claims of a cyclical recession overstate recent economic growth while understating the possibility of a return to the structural decay of the past two decades.
What are the implications of this scenario for the rest of the decade?
If the economy resumes growth at a steady 2.5% pace today, then Puerto Rico would reach full economic recovery (to its peak level from 2005) by 2035. Nonetheless, there is little evidence that the economy will soon return to such a steady pace. Each year of stagnation or contraction pushes the recovery further into the future, at the cost of significant foregone prosperity and human well-being.
Below, a series of visual tests illustrate the conclusions reached in this introduction.
The 2020s were supposed to be the decade of economic recovery for Puerto Rico, an expectation that has not materialized. Today, the EAI remains around 20% below its June 2005 peak. Although the economy experienced a brief recovery between 2021 and 2023, it returned to stagnation thereafter. This can be observed in Figure 1.
Figure 1. The Economic Activity Index became stagnant midway through 2023
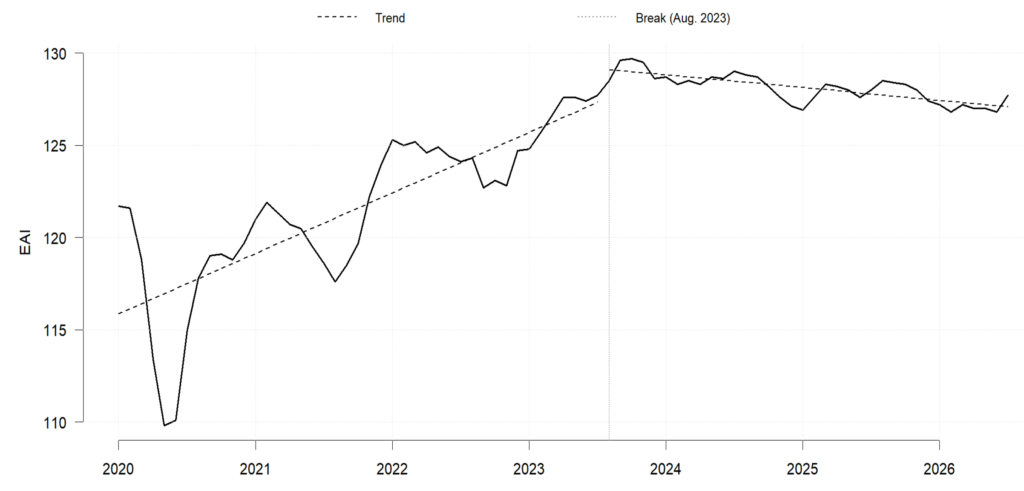
As shown in Figure 1, the EAI has remained stagnant since around August 2023, standing 1.3% lower in June 2026. This suggests a very mild medium-term contraction rather than pure stagnation. Figure 2 examines this more closely.
Figure 2. The Economic Activity Index’s recovery did not last past mid-2023
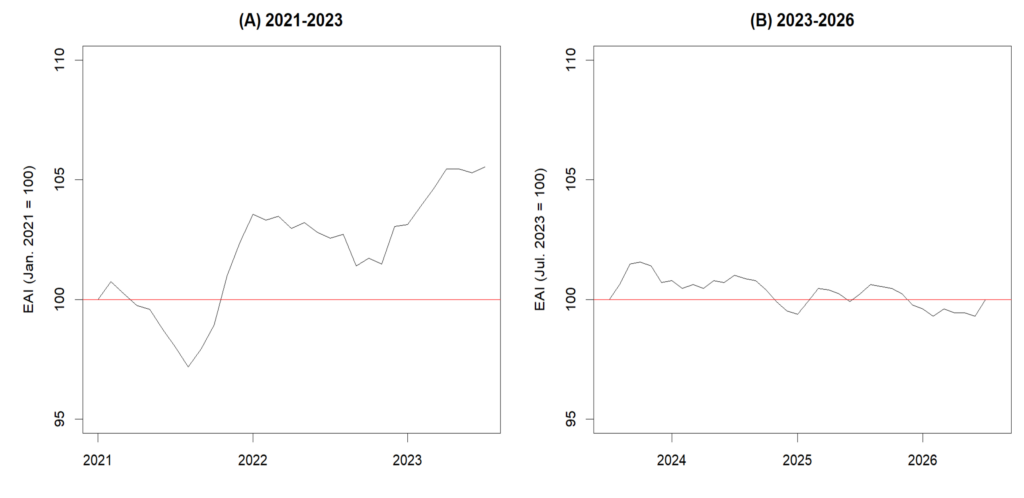
Figure 2 shows EAI performance from 2021 to 2026. Panel A shows a clear upward trend through mid-2023, whereas Panel B is flat to slightly downward from that point onward. The recovery observed between 2021 and 2023 likely reflected a combination of post-pandemic normalization, federal stimulus, and labor market growth. Both post-pandemic normalization and federal stimulus had largely dissipated by late 2023, while labor market growth began slowing sharply in 2024. Figure 3 shows the trend the EAI has followed since 2020, after smoothing out monthly volatility.
Figure 3. The Economic Activity Index’s trend flattened into early 2024 and has declined since
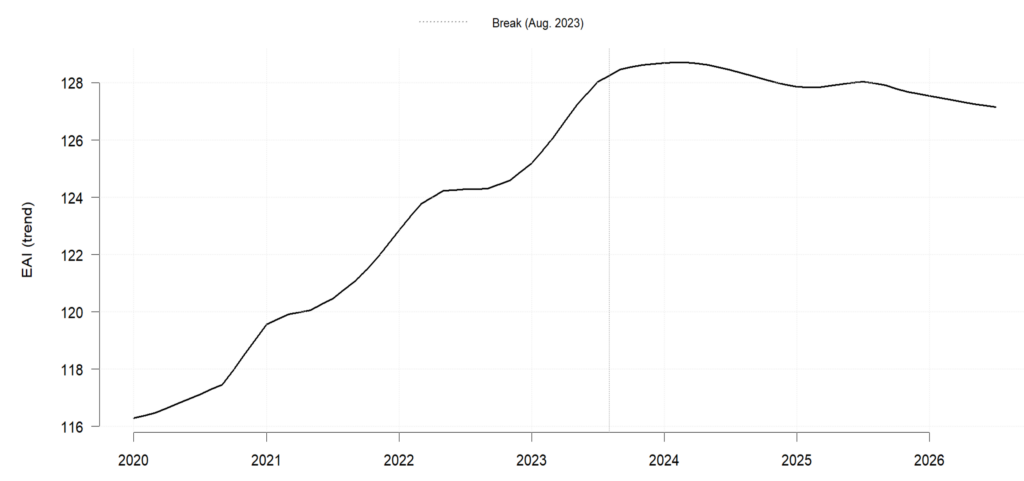
Two aspects stand out in Figure 3. First, the EAI’s shows its sharpest decline from mid-2025 into mid-2026, which is what has been interpreted as a cyclical recession. More striking, however, is that stagnation predates the first signs of a potential cyclical downturn, since the trend flattened abruptly in late 2023 and began to decline in 2024. Thus, the downturn observed in 2026 represents not an interruption of growth, but the point at which a prolonged period of stagnation tipped into outright contraction. In this sense, while characterizing the current downturn as cyclical may seem reasonable, such characterization is incomplete, as it captures the transition into contraction but overlooks the stagnation that preceded it. Had the recovery extended into mid-2025, the current downturn could more reasonably be read as purely cyclical, since the economy would have sustained five consecutive years of growth, as it last did in the early 2000s. Moreover, had the recovery been sustained, this downturn might not be occurring, or at least would be less pronounced.
The distinction between a cyclical recession and structural stagnation is of particular importance for Puerto Rico, where the current downturn must be viewed against the backdrop of two decades of economic decline. If the deterioration in the EAI persists, the current episode could represent a renewed pre-2020-style decline rather than a short-lived cyclical contraction. The next months and years of data will shed light on this.
Another way to test whether the recent deterioration of the economy is cyclical or more persistent is by looking at year-over-year growth in the EAI.
Figure 4. Growth in the Economic Activity Index turned negative in mid-2024 and has stayed there
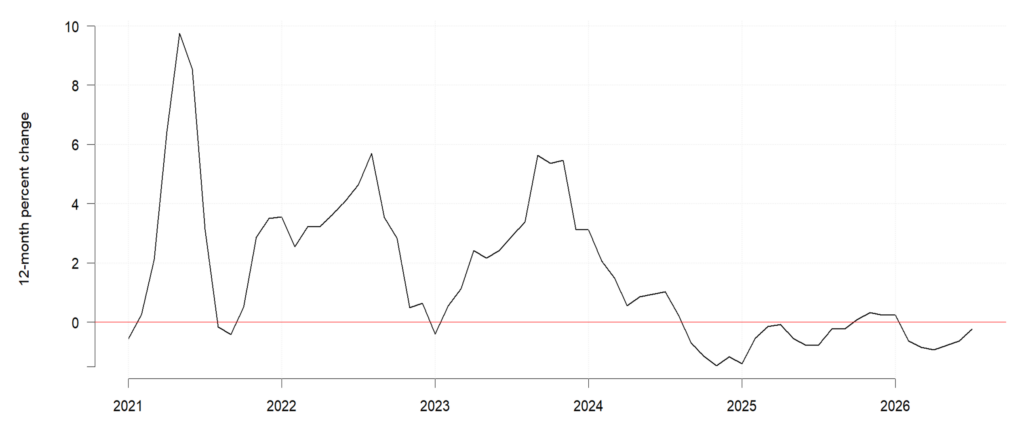
As Figure 4 shows, the EAI registered robust year-over-year growth from 2021 to early 2024. The brief dip toward zero in late 2022 was followed by a rebound, after which growth remained positive until mid-2024. Growth then fell below zero and did not recover: 19 of the last 25 months have recorded negative growth. Average growth was 2.9% between January 2021 and March 2024, and −0.3% since. This constitutes further evidence that the recent deterioration reflects a more persistent decline in economic activity rather than simply a short-lived cyclical contraction. Figure 5 reinforces this interpretation.
Figure 5. Had the pre-2024 growth path been sustained, the Economic Activity Index would stand almost 10% above its current level
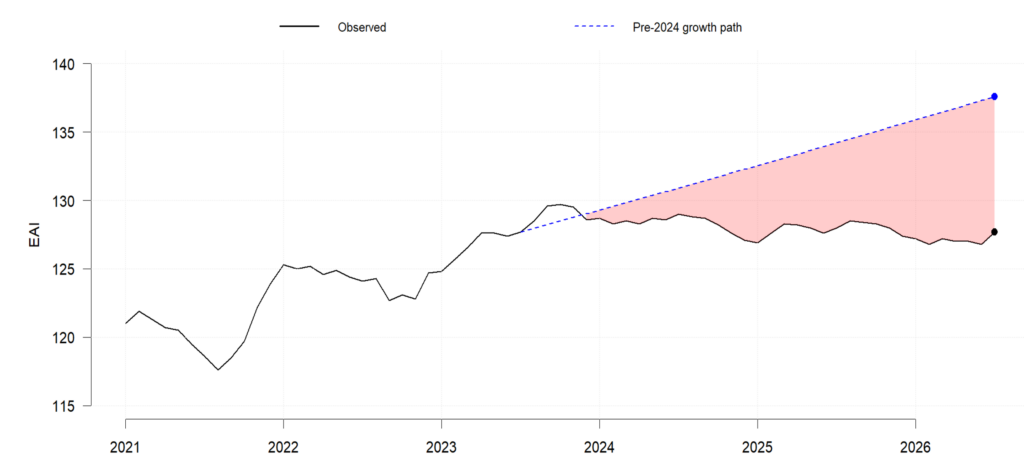
Figure 5 makes the cost of the post-2023 stagnation clear. Had the pre-2024 growth path been sustained, the EAI would stand roughly 8% above its current level, as illustrated by the red shaded area. The gap is significant, representing lower salaries, less saving and investment, fewer job opportunities, and foregone fiscal revenue. Ultimately, it translates into a lower standard of living. The gap also grows over time as the economy stagnates or contracts. What may look today like a cyclical downturn is therefore occurring on top of a much larger loss of momentum.
To put the recent lack of sustained growth into comparative perspective, Figure 5 shows how EAI growth behaved in the 1990s, the last full decade of sustained economic expansion.
Figure 6. The Economic Activity Index’s brief recovery and subsequent stagnation in the 2020s contrasts with the 1990s, Puerto Rico’s last full decade of sustained growth
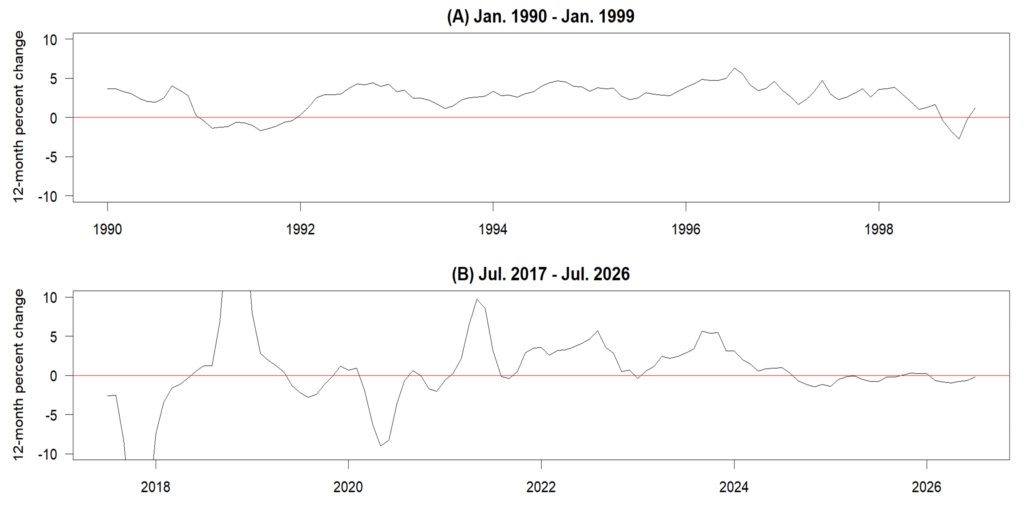
In Panel A, the EAI registered positive year-over-year growth through most of the 1990s. The main exception was the 1990-91 recession. As can be observed, that episode was a traditional interruption of growth, which turned positive again within a year. By contrast, the negative readings in 2026 continue the longer-term pattern that began in early 2024. And while the 2020s have featured more volatility due to external factors than the 1990s, even accounting for these disruptions, growth has struggled to sustain positive momentum. This suggests two implications. First, that the economy continues to carry the structural weakness of the past two decades, leaving it more vulnerable to external shocks. Second, if the current downturn turns out to be a cyclical recession, it may last longer than most expect. This is the case because growth has already been negative for six months, while the effects of the 2026 oil shock have yet to fully pass through the macroeconomy. Against this backdrop, Figure 7 uses EAI growth to provide a timely indication of what real GNP growth could be in fiscal year (FY) 2026, which ended June 30.
Figure 7. Economic Activity Index sluggishness points to further weakness in real gross national product growth for fiscal year 2026
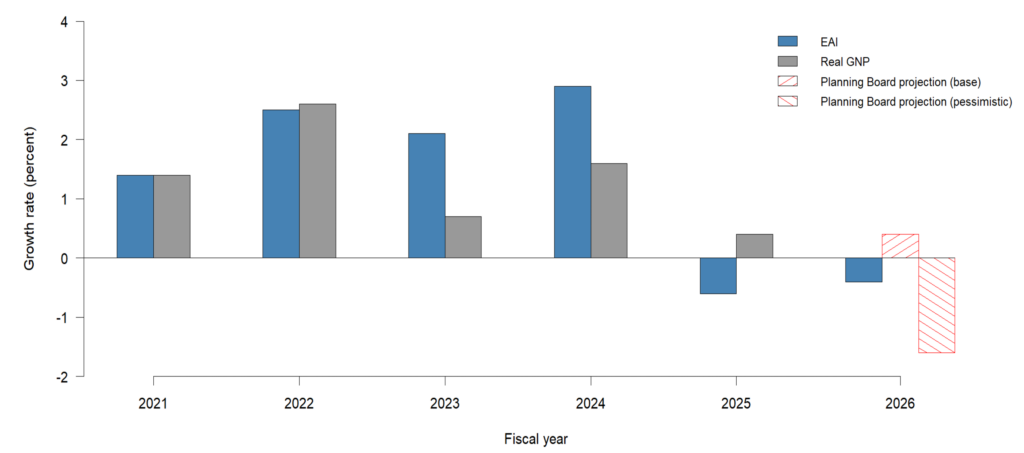
As Figure 7 shows, EAI and real GNP average-annual growth have tended to move together, though magnitudes have differed. FY 2025 is a case in point: both indicators slowed sharply after FY 2024. Since EAI growth was negative in FY 2026, real GNP growth will likely be weak as well. The Puerto Rico Planning Board’s projections point the same way, putting FY 2026 real GNP growth at 0.4% (baseline scenario) and −1.6% (pessimistic scenario). Although a contraction of −1.6% is unlikely, higher oil prices and inflation in 2026 could push growth below the baseline into negative territory. Nonetheless, growth of 0.4% would represent stagnation more than growth. The longer stagnation persists, the longer it will take for the economy to recover to its June 2005 peak, with substantial economic and human costs along the way. Two different recovery horizons can be observed in Figure 8.
Figure 8. Even if growth resumed today at its pre-2024 pace, the Economic Activity Index would not reach its 2005 peak until 2035
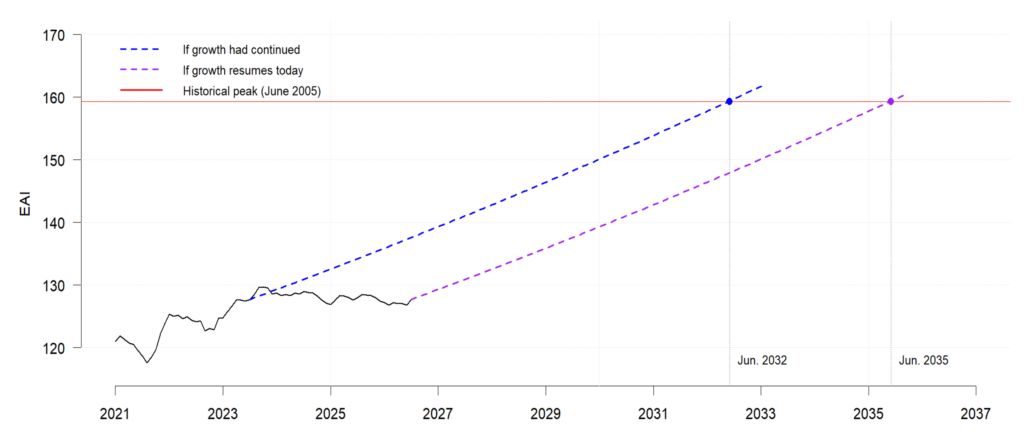
Figure 8 puts the recent stagnation into a longer-term perspective. Holding EAI growth at 2.5% (rate sustained between January 2021 and July 2023), it draws two recovery horizons: one in which the economy kept growing at that pace after 2023, and one in which it resumes that pace today. Even under the first scenario, it would have taken the EAI six more years from today to return to its June 2005 peak, meaning full recovery would have taken 27 years—an entire generation. With the EAI now stagnant for almost three years, full recovery is pushed back to June 2035 under the second scenario. That assumes growth resumes today at the pre-2024 pace, for which there is currently little evidence.
Key Sources
Capella, Gabriel. Federal Funds in Puerto Rico: The ARRA Experience and Lessons for Economic Recovery (Policy Paper). San Juan: Center for Economic Renewal, Growth and Excellence, 2026. https://centrocrece.org/road-to-prosperity-policy-paper-federal-funds-in-puerto-rico/.
Capella, Gabriel. The 2022 and 2026 Oil Shocks: Implications and Policy Options for Puerto Rico (Policy Brief). San Juan: Center for Economic Renewal, Growth and Excellence, 2026. https://centrocrece.org/road-to-prosperity-policy-brief-the-2022-and-2026-oil-shocks-puerto-rico/.
Departamento de Desarrollo Económico y Comercio de Puerto Rico. Estadísticas económicas: Data Center.https://www.desarrollo.pr.gov/en/estadisticas-economicas.
Junta de Planificación de Puerto Rico. Apéndice estadístico del informe económico a la Gobernadora y a la Asamblea Legislativa 2025. Programa de Planificación Económica y Social, 2025. https://www.jp.pr.gov/planificacion-economica-social.