
FEDERAL FUNDS IN PUERTO RICO: THE ARRA EXPERIENCE AND LESSONS FOR ECONOMIC RECOVERY
BY: Gabriel Capella
Research Associate

Source: Pete Souza, public domain, via Wikimedia Commons.
Executive Summary
The American Recovery and Reinvestment Act of 2009 (ARRA) injected $787 billion into the U.S. economy to counter the Great Recession. This paper examines how ARRA funds were allocated across spending types and sectors in Puerto Rico, how effectively they were administered by the local government, and their short-run macroeconomic impact.
The ARRA stands out as the only major federal stimulus program of the last two decades for which the full implementation cycle and economic effects can now be fully observed. This observability is especially valuable in Puerto Rico, where the ARRA coincided with the onset of a prolonged economic contraction that began before the U.S. entered the Great Recession, creating a unique opportunity to assess how large federal transfers interact with Puerto Rico’s institutional capacity, estimate the economy’s counterfactual trajectory in the absence of the stimulus, and derive lessons for the design and execution of ongoing and future recovery efforts. More broadly, this setting also illustrates that the effects of large-scale government stimulus programs can vary across regions depending on policy choices, structural conditions, and administrative capacity.
KEY FINDINGS
- Funding magnitude: Puerto Rico received approximately $6.3 billion in ARRA funds, equivalent to 6.5 percent of its 2009 nominal gross domestic product (GDP).
- Funding composition: Of the total, $2.7 billion went to Awards (primarily education programs and infrastructure and housing projects); $2.2 billion to Entitlements, notably the Nutrition Assistance Program (NAP); and $1.4 billion to Tax Relief for individuals, households, and businesses.
- Funding timing: Disbursements occurred between 2009 and 2013, peaking in 2010.
- Administrative performance: Federal oversight reports and audits found no systemic fraud but identified deficiencies in project tracking, documentation, and data management.
- Short-run macroeconomic impact: Model-based estimates suggest that, without the ARRA, by 2013 Puerto Rico’s real GDP would have declined by a cumulative 7.0 percent relative to its 2008 level. Over the same period, the observed decline was 3.0 percent—less than half as large. In level terms, real GDP was approximately $4.33 billion (4.3 percent) above the model’s no-ARRA projection by 2013.
POLICY LESSONS
- Federal spending can cushion a prolonged contraction, but only temporarily. The ARRA was associated with a cushioning of Puerto Rico’s post-2004 contraction, but it did not resolve underlying structural weaknesses—that is, constraints on the economy’s capacity to generate sustained growth—such as low levels of private investment, low labor participation rates, and high costs of doing business.
- Sustained prosperity depends on local competitiveness, not top-down federal transfers. While federal inflows can stabilize economic activity in the short run, durable growth requires an adaptable policy environment and reforms —particularly in foundational areas such as taxation, bureaucracy, and institutional frameworks—that support private investment.
- Implementation capacity and local discretion shape impact. Federal spending is most effective when local agencies have efficient administrative systems and sufficient flexibility to adapt funds to local needs.
- Transparency and data infrastructure strengthen governance. The Recovery.gov model demonstrates that accessible spending and project-level data improve accountability, reduce waste, and support better public and private decision-making.
1. Introduction
“The task which faces contemporary students of the business cycle is that of sorting through the wreckage.”
—Nobel Prize-winning economists
Robert Lucas and Thomas Sargent (1978, p. 49)
Robert Lucas and Thomas Sargent wrote in the 1970s, when the U.S. economy—and Puerto Rico’s—was experiencing a stark episode of what economists call stagflation, a troubling combination of high unemployment and high inflation. At the time, dominant Keynesian macroeconomic models struggled to explain the persistence of inflation. Lucas and Sargent addressed this limitation by placing rational expectations at the center of macroeconomics, emphasizing the role of expectations in shaping policy outcomes (Blinder, 2022). The result was a more nuanced understanding of the business cycle and the limits of stabilization policy. This is not intended to dismiss Keynesianism, but to underscore the importance of revisiting and adapting policy frameworks to improve outcomes.
While economic conditions differed significantly in 2009, the task at hand is similar: to sort through the evidence on American Recovery and Reinvestment Act (ARRA) spending in Puerto Rico and assess what it meant for the economy. This policy paper is not about complex macroeconomic models and frameworks, but about understanding how a historic episode of expansionary fiscal policy dictated the spending of appropriations, how funds flowed in Puerto Rico, and how they affected short-run growth. By tracing allocations across sectors and their interaction with Puerto Rico’s economic context, the paper draws lessons about the effectiveness of federal spending, retrospectively in a contractionary context and proactively in a recovery context.
Beyond its local relevance, Puerto Rico’s ARRA experience contributes to broader debates about how broad-based stimulus programs interact with regional economies. Because most empirical evaluations of the ARRA focus on the macroeconomic context of the U.S. as a whole, Puerto Rico’s markedly different economic conditions offer a useful point of comparison for assessing how regional characteristics and policy environments shape the impact of countercyclical fiscal policy.
The paper is structured as follows. Section 2 outlines the U.S. macroeconomic context during the Great Recession and the policy design of the ARRA. Section 3 summarizes nationwide spending totals. Section 4 examines the allocation of ARRA funds in Puerto Rico and the programs and sectors through which they were administered. Section 5 reviews oversight findings related to Puerto Rico’s administrative performance. Section 6 analyzes ARRA’s short-run macroeconomic impact, including counterfactual estimates based on an empirical model. Section 7 concludes with key lessons for economic recovery policy.
2. The Great Recession and the ARRA
The ARRA was enacted against the backdrop of the Great Recession of 2007–2009. Triggered by the collapse of an overleveraged housing market and widespread high-risk financial practices, the downturn became the deepest contraction experienced by the U.S. economy since the Great Depression of 1929 (U.S. Department of Commerce, Bureau of Economic Analysis [BEA], 2011). From January to March 2009, the U.S. economy shed an average of roughly 691,000 jobs per month, and the unemployment rate peaked at 10 percent in October 2009 (U.S. Department of Labor, Bureau of Labor Statistics [BLS], 2010). At the time, the natural rate of unemployment—the unemployment rate when the economy operates at full output potential—was estimated at about 4.8 percent by the Congressional Budget Office (CBO, 2009) and closer to 6.3 percent by the Federal Reserve (Daly et al., 2011). This implies that actual unemployment exceeded its natural rate by roughly 60–100 percent. On the output side, BEA data indicate that U.S. real gross domestic product (GDP) fell 5.1 percent from its pre–Great Recession peak and did not recover until the third quarter of calendar year 2011 (Bonham, 2011).
For context, during the Great Depression U.S. GDP fell by approximately 29 percent between 1929 and 1933, and the unemployment rate peaked at 25 percent in 1933 (Federal Reserve Bank of St. Louis, n.d.). By comparison, the Depression GDP drop was 7 times that of the Recession, and the unemployment spike was almost 2.5 times the size. In magnitude and duration, the Great Depression therefore represented an economic collapse of an entirely different order. The difference in macroeconomic scale is summarized in Box 1.
Box 1. Scale of Collapse: Great Depression vs. Great Recession

The ARRA, then, had a clear objective: to prevent a second depression by injecting money into the economy. Under Keynesian macroeconomic theory, this infusion of spending would boost aggregate demand, increase output, and raise employment. At enactment, the law’s official price tag was $787 billion, with total costs later estimated to exceed $830 billion through 2019 (CBO, 2014).
With the economy collapsing so rapidly, averting a second depression was no easy task. For this reason, the Obama administration’s economic team, working with Congress, emphasized that the stimulus needed to be “timely, targeted, and temporary”: timely to slow the collapse; targeted toward spending-prone households, demand-sensitive activities, and “shovel-ready” projects; and temporary to signal fiscal responsibility (Grunwald, 2012, p. 60). It was nevertheless recognized that no amount of stimulus politically feasible in Congress could quickly reverse the downturn and restore growth. Ensuring that spending met the “three-T test” was therefore viewed as a way to maximize short-run impact.
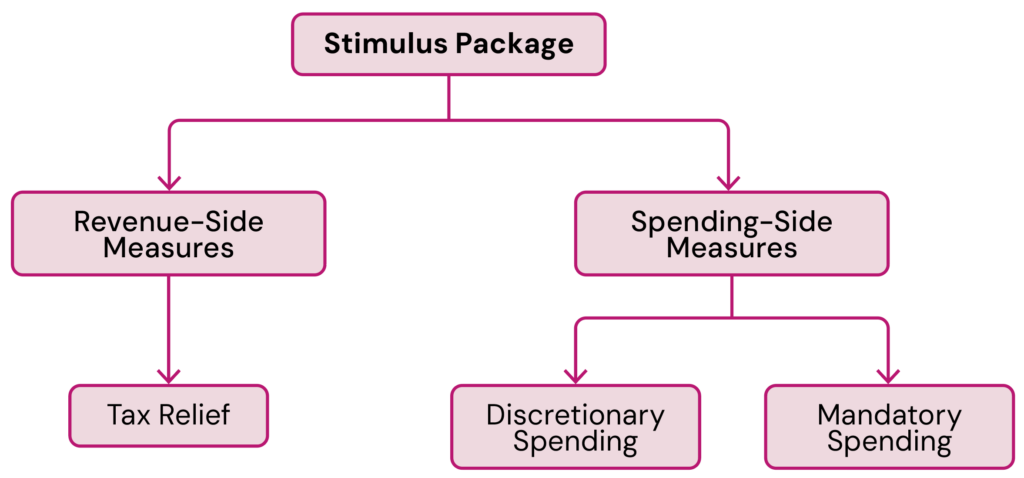
On February 17, 2009, less than a month into the Obama administration, the ARRA was signed into law, delivering stimulus through both revenue- and spending-side fiscal measures (Pub. L. No. 111-5, 123 Stat. 115). On the revenue side, Congress enacted temporary tax relief for individuals, households, and businesses (Figure 1). On the spending side, it authorized new discretionary appropriations for agency initiatives, along with mandatory appropriations via temporary expansions of entitlement programs.
Figure 1. Structure of the American Recovery and Reinvestment Act of 2009 (ARRA)
Source: Multiple summaries of the ARRA.
Once the stimulus was signed into law, the administration’s next challenge was implementation, which proceeded through two main channels. On the revenue side, the Department of the Treasury and the Internal Revenue Service (IRS) implemented tax relief through the tax administration system. On the spending side, federal agencies were required to obligate and disburse large sums in grants, contracts, loans, and entitlements, while ensuring compliance with oversight rules under the supervision of the Recovery Accountability and Transparency Board (RATB).
The ARRA established the RATB as a temporary body to oversee spending flows, prevent fraud, and operate the Recovery.gov transparency portal. Through Recovery.gov, the public had access to detailed, near-real-time data on how funds were awarded, obligated, and spent, with the aim of promoting accountability, building public trust, and setting new standards for transparency in federal spending. Spending was organized into three categories that mirrored the law’s fiscal measures: Awards, Entitlements, and Tax Relief.
3. Overview of Total ARRA Spending
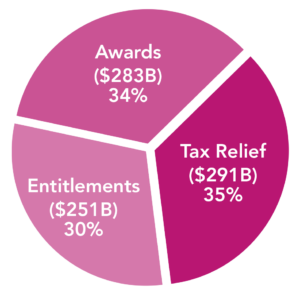
This section presents aggregated spending totals reported across all states and territories, organized according to Recovery.gov’s official categories. Figure 2 illustrates the distribution of spending across these three categories.1
Figure 2. Nationwide Distribution of Total Spending by Category
3.1 AWARDS
The Awards category was the classification assigned by Recovery.gov to ARRA’s discretionary appropriations. These funded one-time investments in specific programs and projects administered through federal agencies, accounting for about 34 percent of total spending, or roughly $283 billion.
Recovery.gov further divided this category into three subcomponents: contracts, grants, and loans. Grants—both formula-based and competitive—accounted for approximately 85 percent of Awards ($241 billion), reflecting the administration’s priority to deliver stimulus rapidly, as they could be disbursed faster than contracts or loans. By the end of Fiscal Year (FY) 2011, roughly two and a half years after the law’s enactment, federal agencies had outlaid around 97 percent of grants, equivalent to 83 percent of total Award spending.
Awards were directed toward projects in key domains of public investment, including education, health, housing, infrastructure, transportation, energy, and research and development (R&D). Combined, these sectors accounted for about 83 percent of total Award spending, with education alone receiving roughly 33 percent.
3.2 ENTITLEMENTS
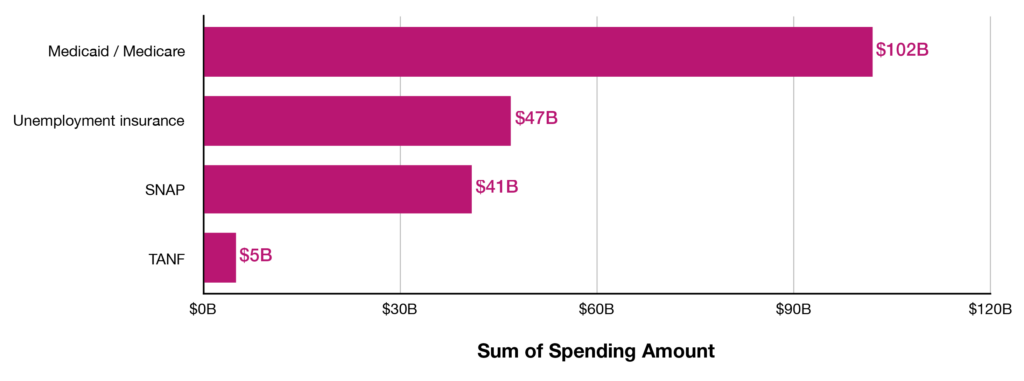
The Entitlements category accounted for about 30 percent of total ARRA spending, or approximately $251 billion. Of this amount, $195 billion (78 percent) was allocated to four programs: Medicaid/Medicare; unemployment insurance (UI); the Supplemental Nutrition Assistance Program (SNAP); and Temporary Assistance for Needy Families (TANF). Figure 3 illustrates the distribution of spending across these programs.
Figure 3. Nationwide Entitlement Spending by Program
3.3 TAX RELIEF
The Tax Relief category accounted for about 35 percent of total ARRA spending, or roughly $291 billion. Of this amount, $132 billion (45 percent) was allocated to benefits for individuals other than the Making Work Pay (MWP) tax credit. The MWP provided up to $400 for individuals and $800 for joint filers per year through reduced income tax withholding in 2009 and 2010 (IRS, 2010), accounting for 36 percent ($104 billion) of total Tax Relief spending. Including MWP, incentives for individuals represented 81 percent of the total. The remaining 19 percent supported incentives for businesses (11 percent; $33 billion); energy (4 percent; $11 billion); manufacturing and infrastructure (2 percent; $7 billion); and COBRA (1 percent; $4 billion). COBRA, the Consolidated Omnibus Budget Reconciliation Act of 1985, allows laid-off workers and their families to retain employer-sponsored health coverage for up to 18 months at their own expense (U.S. Department of Labor, Employee Benefits Security Administration, 2022). Under the ARRA, 65 percent of those costs were temporarily subsidized, reducing the burden on terminated workers to 35 percent (Berk & Rangarajan, 2015).
4. Breakdown of ARRA Funds in Puerto Rico
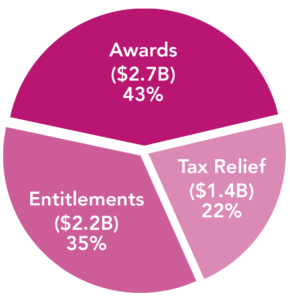
Under the ARRA, Puerto Rico received approximately $6.3 billion: 43 percent ($2.7 billion) in Awards; 35 percent ($2.2 billion) in Entitlements; and 22 percent ($1.4 billion) in Tax Relief (Figure 4).2
Figure 4. Distribution of Total Funds by Spending Category
4.1 AWARDS
Nearly 85 percent of Award funds—about $2.3 billion—went to the education, health, housing, infrastructure, transportation, and energy sectors. The education sector alone received nearly $1.2 billion, or 44 percent of all Award funds, making it the main channel through which ARRA support reached Puerto Rico. The following section details how these resources were allocated across key programs and institutions.
4.1.1 EDUCATION
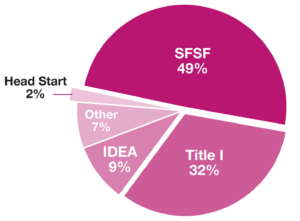
The largest recipients of education Awards were the Office of the Governor and the Department of Education. The Office of the Governor received $647 million through the State Fiscal Stabilization Fund (SFSF), a program created by the ARRA to provide temporary fiscal relief through the U.S. Department of Education (ED). By statute, states were required to direct 82 percent of SFSF funds to education (GAO, 2011). In Puerto Rico, this translated into roughly $410 million for the Department of Education and $120 million for the University of Puerto Rico (UPR)—a combined $530 million, or 82 percent of the allocation.3 Of the remaining $117 million, the Office of the Governor allocated $55 million to modernizing 250 schools, raising the education share of SFSF funding to nearly 90 percent.
In addition to the SFSF allocation, the Puerto Rico Department of Education directly received about $555 million. Nearly $501 million (90 percent) came from two programs: Title I, Part A, of the Elementary and Secondary Education Act (hereafter, Title I), which provided $389 million to support schools serving low-income students, and the Individuals with Disabilities Education Act of 1975 (IDEA), which channeled $112 million to guarantee education services for students with disabilities. ARRA’s temporary expansion of both programs allowed Puerto Rico to retain teachers and sustain critical services.
Education Awards also supported municipalities through Head Start and Early Head Start grants, with Bayamón, Caguas, Carolina, Guaynabo, Mayagüez, Ponce, and San Juan among the recipients.
Figure 5 shows each program’s share of total education funding.
Figure 5. Breakdown of Education Award Funds by Program
4.1.2 OTHER SECTORS
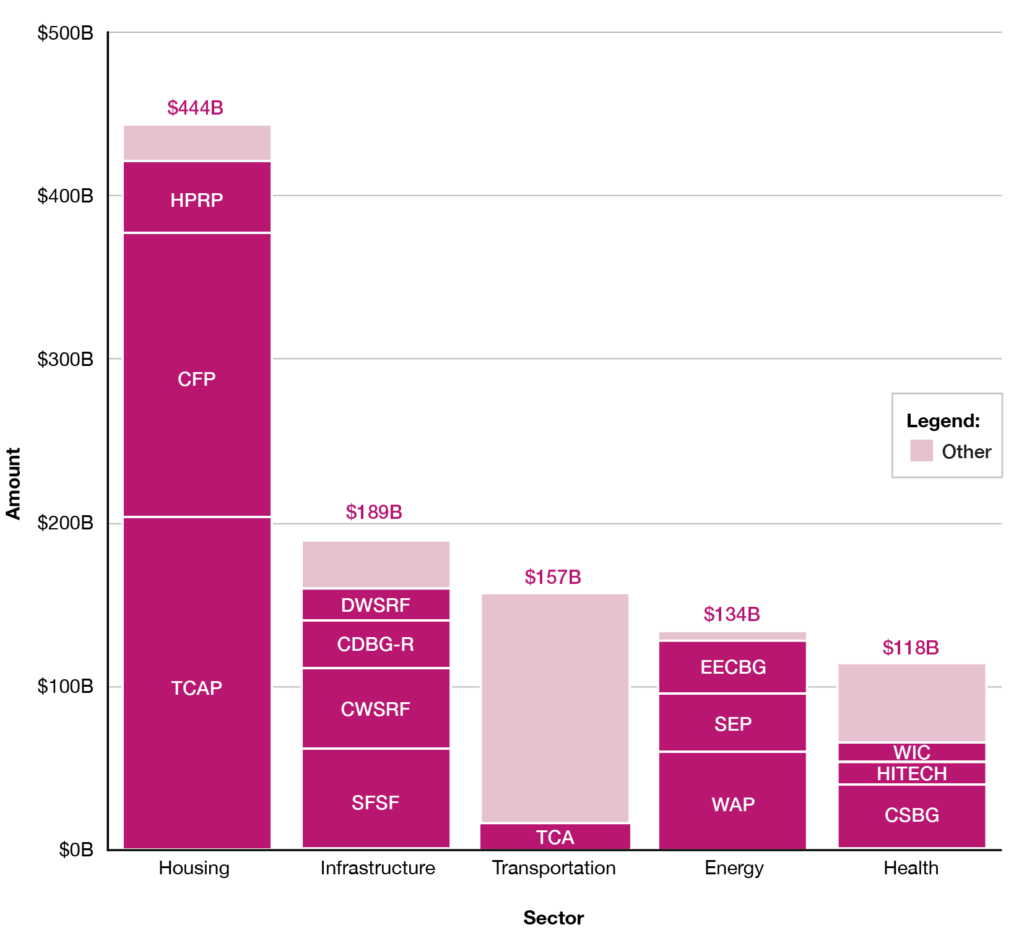
Nearly $1.1 billion (39 percent of Award funds) flowed into the health, housing, infrastructure, transportation, and energy sectors. Figure 6 details the breakdown across these sectors.
Figure 6. Breakdown of Award Funds by Sector (Selected Programs)
Sources: Recovery.gov, ARRA implementation reports, and unpublished local records.
Housing received about $444 million, distributed mainly through three programs: the Homelessness Prevention and Rapid Re-Housing Program (HPRP), which provided $45 million for rental assistance to families at risk of homelessness; the Capital Fund Program (CFP), which directed $175 million toward the rehabilitation and modernization of public housing; and the Tax Credit Assistance Program (TCAP), which invested $204 million in affordable rental construction.
Infrastructure investments totaled nearly $70 million through the Clean Water and Drinking Water State Revolving Funds (CWSRF and DWSRF, respectively) to modernize water systems, along with $29 million in Community Development Block Grant Recovery (CDBG-R) funds for local infrastructure and community projects. In addition, SFSF allocations covered $42 million for State Police payroll costs and $20 million for the Infrastructure Financing Authority (AFI, for its Spanish acronym).4
Transportation funds were largely distributed through individual grants, though the Transit Capital Assistance (TCA) Program invested $15 million in sustaining and upgrading public transit.
Energy support totaled about $134 million and was concentrated in three major programs. The largest share came from the Weatherization Assistance Program (WAP), which invested $65 million in home energy-efficiency upgrades. The Energy Efficiency and Conservation Block Grant (EECBG) directed $28 million toward efficiency improvements at the municipal level, while the State Energy Program (SEP) contributed $37 million to expand clean-energy adoption.
Health programs received about $118 million. The largest share flowed through the Community Services Block Grant (CSBG), which allocated $40 million to community organizations providing social and health services in disadvantaged areas. The Special Supplemental Nutrition Program for Women, Infants, and Children (WIC) distributed $10 million in nutritional support for low-income mothers and children, while the Health Information Technology for Economic and Clinical Health Act (HITECH) invested $14 million to expand the use of electronic health records.
4.2 ENTITLEMENTS
Entitlement funds flowed primarily into the Nutrition Assistance Program (NAP), UI, Medicaid/Medicare, and TANF. Figure 7 shows the allocation across these programs.
Figure 7. Entitlement Funds by Program
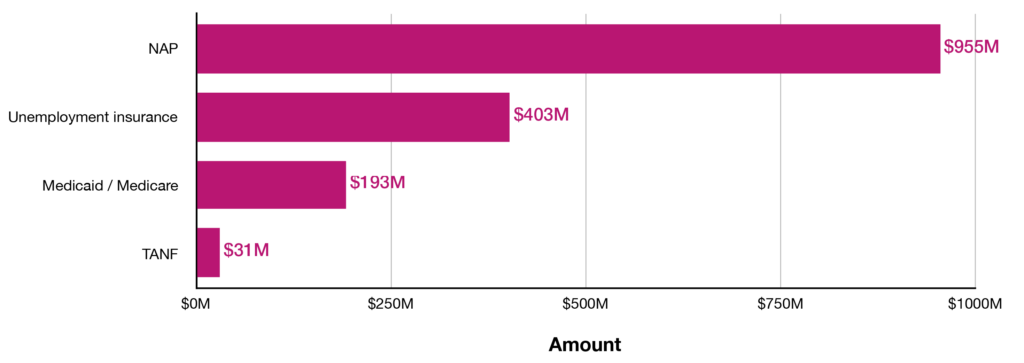
NAP received a $955 million increase in funds, temporarily expanding Puerto Rico’s food assistance block grant. The additional funding provided households with approximately $20 to $25 more per person each month through October 2013 (U.S. Department of Agriculture, Food and Nutrition Service [FNS], n.d.). Serving roughly 1.18 million beneficiaries in 2009, the expansion was designed to mirror the 13.6 percent benefit increase implemented under SNAP in the U.S. mainland (Peterson et al., 2010, p. 1).
UI received about $403 million, including nearly $169 million to raise weekly benefits by $25 per claimant (Congressional Research Service [CRS], 2010, p. 2), and $168 million to extend coverage from the standard 26 weeks to as many as 52 weeks (CRS, 2010, p. 3). By the fourth quarter of 2009, an average of roughly 110,000 Puerto Ricans per week were receiving unemployment insurance (U.S. Department of Labor, Employment and Training Administration, 2009), indicating that these changes strengthened the safety net for thousands of households facing job loss.
Medicaid funding increased by 30 percent (Medicaid and CHIP Payment and Access Commission, 2019, p. 82), with Puerto Rico’s capped federal allotment rising by $188 million between October 2009 and June 2011. At the time, about 1.57 million individuals were enrolled (GAO, 2010a, p. 40), meaning the additional support amounted to roughly $120 per beneficiary. Medicare provisions added another $5 million for prescription drugs under Part D, easing out-of-pocket costs for low-income seniors and individuals with disabilities.
TANF, the main federal cash assistance program for low-income families with children, received an additional $31 million through ARRA’s Emergency Contingency Fund. These funds helped vulnerable households meet immediate needs and supported subsidized employment opportunities.
Beyond these recurring programs, the ARRA also provided a one-time $250 payment to Social Security beneficiaries (Szymendera, 2009). With approximately 660,000 adult beneficiaries in Puerto Rico as of December 2008 (Social Security Administration, 2009), this translated into roughly $165 million in direct relief, delivering immediate cash support to seniors and disabled workers during the recession.
4.3 TAX RELIEF
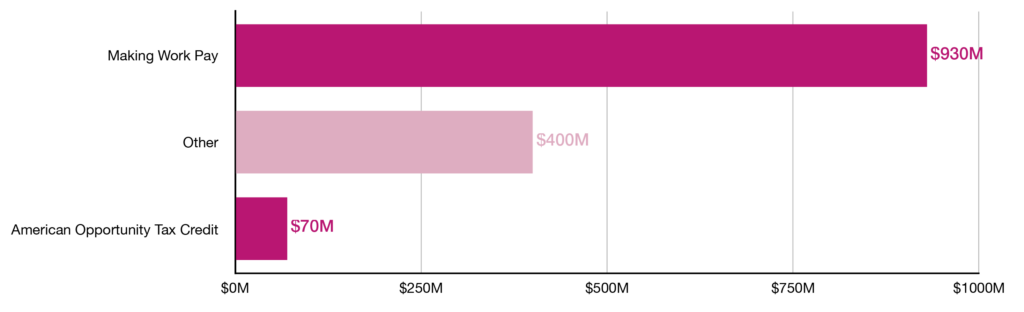
Because Puerto Rico residents do not file federal income taxes, Tax Relief funds were delivered through U.S. Treasury transfers to the Puerto Rico Department of the Treasury, which then distributed benefits locally (Enchautegui, 2014). Funds came primarily from the MWP and the American Opportunity Tax Credit (AOTC). In 2009 and 2010, the MWP disbursed around $930 million to workers who filed a Puerto Rico tax return by means of checks of $400 per year for individuals and $800 per year for joint filers (Departamento de Hacienda, 2010c). For those same years, the AOTC allowed families to claim up to $2,500 per dependent enrolled in college for qualified expenses, of which up to $1,000 per year was refundable if the credit exceeded their tax liability (U.S. Department of the Treasury, 2010; Departamento de Hacienda, 2010b). Figure 8 reports the breakdown of Tax Relief funds.
Figure 8. Breakdown of Tax Relief Funds
Sources: Recovery.gov, ARRA implementation reports, and unpublished local records.
5. Compliance and Oversight: Puerto Rico’s Performance Administering the ARRA
Transparency, public trust, and compliance were central to ARRA’s design. States and territories were required to track every dollar and project, enforce strict oversight rules, and submit quarterly reports to FederalReporting.gov (Office of Management and Budget, 2009). These reports detailed obligations, expenditures, and estimates of jobs created or saved. In addition, the RATB, agency OIGs, and the GAO conducted periodic assessments of data quality, project documentation, and fraud risk.
In Puerto Rico, no evidence of systemic or large-scale fraud was identified, but OIG assessments flagged weaknesses similar to those observed in other jurisdictions, including incomplete data from subrecipients and contractors, inadequate project documentation, and staffing constraints (U.S. Department of Education Office of Inspector General [ED OIG], 2013; ED OIG, 2014; GAO, 2010b). Federal audits across the Departments of Education, Housing and Urban Development (HUD), Transportation, and Health and Human Services found that Puerto Rico agencies frequently failed to follow procurement standards, including the Department of Education’s $3.4 million in equipment purchases made without competitive bidding and similar practices in municipal contracting (ED OIG, 2013; U.S. Department of Housing and Urban Development Office of Inspector General [HUD OIG], 2009a). Financial management systems were also often unreliable, with unsupported or unallowable costs, missing documentation, and unaccounted program income—most notably the Public Housing Administration’s inability to justify over $18 million in expenses (HUD OIG, 2009b). Timeliness also posed a challenge. The Department of Education, for example, left $35 million in Title I funds unspent beyond required deadlines (ED OIG, 2013).
Collectively, the issues flagged by federal assessments and audits reflected administrative challenges—fragmented oversight, outdated systems, and slow spending—rather than deliberate misuse of ARRA resources.
6. The ARRA and the Onset of Puerto Rico’s Economic Crisis

Puerto Rico’s economic struggles in the 21st century predated the effects of the Great Recession. Real GDP and GDP per capita began declining in around 2005—well before the global downturn and the collapse of the U.S. housing market in 2006–2007 (World Bank [WB], n.d.). That Puerto Rico entered a downturn before the U.S. was unusual, given that earlier episodes of contraction had been more closely tied to the U.S. business cycle and global disruptions (Bram et al., 2008). With the exception of near-zero growth of 0.03 percent in 2012, output remained in contraction through 2018 before turning positive in 2019, in the aftermath of Hurricane María—roughly 15 years of decline (Figure 9).
Figure 9. Puerto Rico Real GDP and Real GDP per Capita, 2000–2024
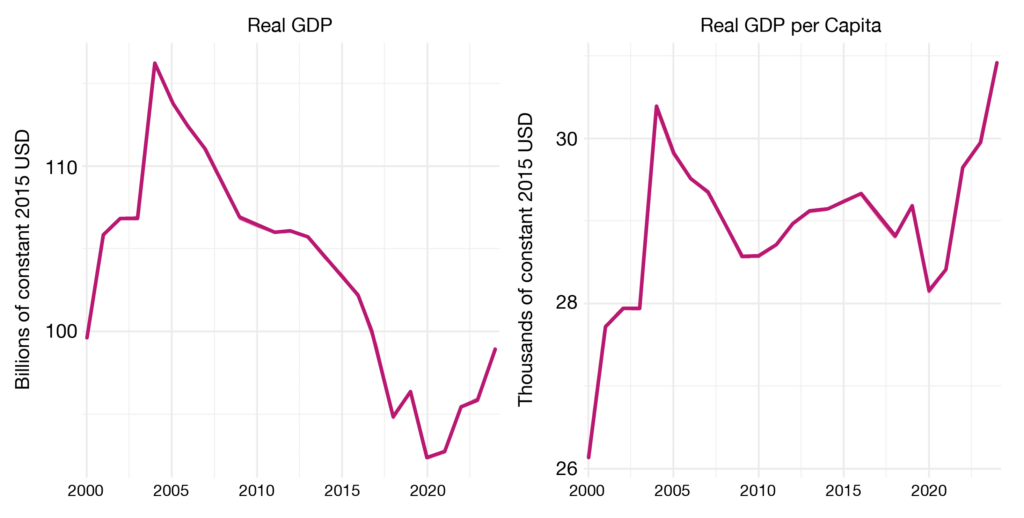
This prolonged stagnation points to structural rather than cyclical weaknesses. It reflects long-term changes in Puerto Rico’s growth model and productive processes, rather than short-term fluctuations in demand. These changes were catalyzed by the repeal of Section 936 (Feliciano & Green, 2017).
Section 936, enacted by Congress as part of the Tax Reform Act of 1976, allowed U.S. corporations to repatriate profits earned in Puerto Rico free of federal corporate income taxes (U.S. Department of the Treasury, 1983). Its predecessor, Section 931, had subjected repatriated profits to taxation. The more favorable terms under Section 936 enhanced Puerto Rico’s attractiveness as a hub for capital-intensive manufacturing and anchored growth for more than two decades, until the provision was gradually phased out between 1996 and 2006 (Santos-Lozada et al., 2020, p. 45).
The repeal eroded Puerto Rico’s competitiveness at a time when the U.S. was expanding its network of free trade agreements (Caraballo-Cueto & Lara, 2018). As a result, foreign investment slowed, output contracted, employment declined, and outmigration accelerated. These structural pressures were compounded by growing fiscal instability—including the May 2006 government shutdown, the introduction of a 7 percent sales tax that same year, and rising public debt—and ultimately exacerbated by the Great Recession.5
6.1 MACROECONOMIC IMPACT OF THE ARRA
Between 2005 and 2008, Puerto Rico’s real GDP growth averaged −1.6 percent per year (WB, n.d.). Output declined from about $116 billion in 2004 to roughly $109 billion in 2008—a cumulative contraction of 6.2 percent. Such a sustained decline was unprecedented in Puerto Rico’s modern history: from 1961 to 2004, the economy recorded only four years of negative growth (1975, 1982, 1983, and 1990). A downturn of this magnitude had not occurred since the Great Depression.
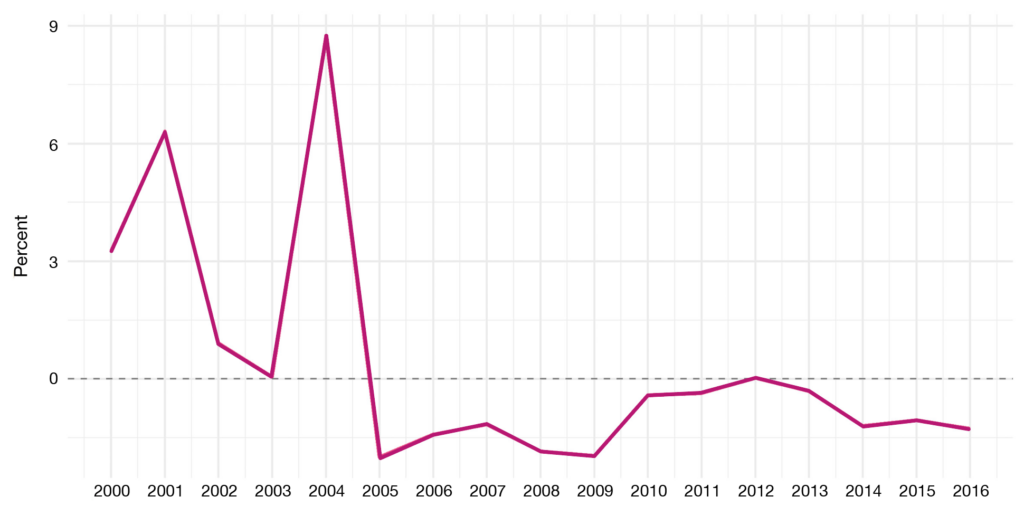
By 2008, Puerto Rico was already in a deep recession. ARRA’s arrival in 2009 coincided with a brief easing of the downturn. Between 2009 and 2012, as federal stimulus inflows reached an amount equivalent to 6.5 percent of 2009 nominal GDP, average annual growth improved to −0.7 percent (WB, n.d.). After 2012, as the stimulus waned, the economy reverted to an average contraction of −1.0 percent per year through 2016.
The less-negative growth observed during 2009–2012 is consistent with a short-run cushioning effect (as seen descriptively in Figure 10). Yet despite the infusion of funds, output remained in negative territory—suggesting that federal stimulus may have mitigated the decline but was insufficient to reverse entrenched structural weaknesses.
Figure 10. Puerto Rico Real GDP Growth, 2000–2016
A smaller, locally funded stimulus enacted in March 2009 complemented the ARRA, with appropriations totaling roughly $500 million (Ley Núm. 9-2009). Spending focused primarily on shovel-ready infrastructure projects and loan guarantees for small and medium-sized enterprises. Together, the local stimulus and the ARRA amounted to about $6.8 billion during 2009–2012—roughly 7.1 percent of 2009 nominal GDP. During this period, the Puerto Rico government’s strategy also included tax and fiscal reforms aimed at addressing the structural deficiencies underlying the recession and supporting continued access to capital markets (Departamento de Hacienda, 2010a). Between 2010 and 2011, credit ratings on the government’s general obligation bonds generally improved, remained stable until late 2012, and deteriorated further in early 2013, reaching “junk” status by 2014 (Charles River Associates, 2014).
6.1.1 COUNTERFACTUAL SCENARIO WITHOUT THE ARRA
Using a simple Interrupted Time Series (ITS) econometric model, Puerto Rico’s economic trajectory was simulated under a counterfactual scenario without the ARRA. ITS methods identify structural breaks in a variable’s time path associated with a policy intervention—in this case, the implementation of the federal stimulus between 2009 and 2012. Effects are estimated through 2013, capturing both the active disbursement years and one lagged period to account for delayed macroeconomic effects.
The econometric estimates rely on a specification that models Puerto Rico’s real GDP growth as a function of its own persistence over the previous two years, the ARRA stimulus window, and the long-running structural decline that began in around 2005. This approach approximates the short-run stimulus effect by estimating how the post-2009 trajectory diverges from the without-ARRA counterfactual path implied by pre-2009 trends, under the assumption that no abrupt shift in the economy’s underlying path would have occurred absent the ARRA. As with all ITS applications using annual macroeconomic data, the results should be interpreted as indicative rather than fully causal. This reflects the small sample size relative to the number of explanatory variables, the overlap between the ARRA and the locally funded stimulus package enacted in 2009, and the difficulty of fully separating short-run stabilization from long-standing structural forces. Appendix C reports the full model specification, diagnostics, and robustness checks, which show generally consistent results. The model’s core results are presented below.
Overall GDP change. The model estimates that, without the ARRA, by 2013 Puerto Rico’s real GDP would have contracted by a cumulative 7.0 percent relative to its 2008 level. With the ARRA, the observed decline over the same period was 3.0 percent—less than half as large (WB, n.d.).
Counterfactual GDP levels. The model estimates that, by 2013, with-ARRA real GDP was roughly $4.33 billion—or about 4.3 percent—above the counterfactual path. This does not indicate that output grew that much between 2008 and 2013. Rather, it suggests that the economy was 4.3 percent larger than it would have been in the absence of the ARRA. The federal stimulus is therefore associated with cushioning the downturn and preserving a meaningful share of Puerto Rico’s output. The underlying GDP levels are reported in Table 1.
Table 1. Puerto Rico Real GDP Levels: Actual, With ARRA, and Without ARRA
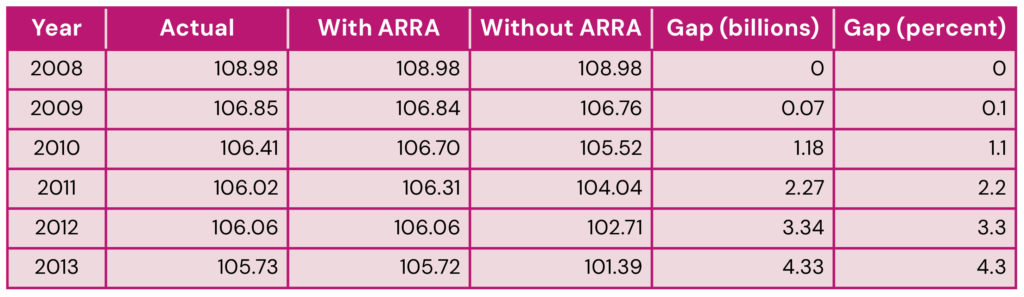
Sources: Values in the “Actual” column are from the World Bank, World Development Indicators; other values are model-based.
Average growth rates. On average, the federal stimulus was associated with raising Puerto Rico’s annual real GDP growth by about 0.8 percentage points between 2009 and 2013—nearly a full percentage point per year. The model estimates that under the with-ARRA scenario, growth averaged −0.6 percent over this period, compared with −1.4 percent under the without-ARRA path. Figure 11 illustrates this divergence.
Figure 11. Puerto Rico Real GDP Growth, With vs. Without ARRA, 2005–2015
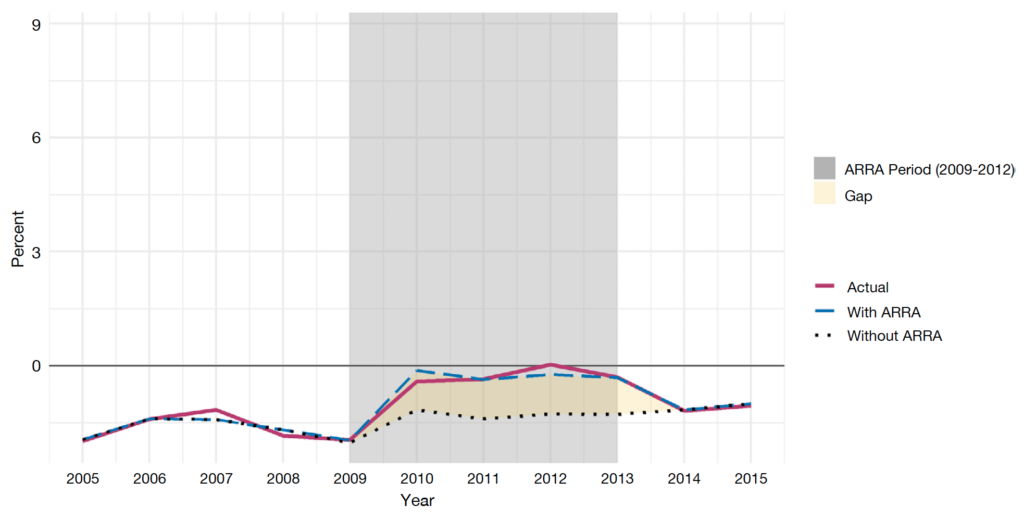
In the figure, the “With ARRA” line shows the ITS-simulated path of real GDP growth with the federal stimulus, while the “Without ARRA” line represents the counterfactual path with ARRA set to zero. Outside the stimulus window, the two paths converge, whereas within it, the gap between them persists slightly beyond 2012 into 2013 due to the model’s lagged ARRA term. The “Actual” line tracks observed real GDP.
Together, the quantitative estimates, table, and simulation plot provide evidence consistent with an ARRA-associated cushioning of Puerto Rico’s economic decline.
7. Conclusion
Model-based estimates suggest that the ARRA provided Puerto Rico with an important—though temporary—cushion during its most severe economic contraction in modern times. Conditional on the model’s assumptions, the counterfactual estimates presented here indicate real GDP may have fallen by more than twice as much between 2008 and 2013 in the absence of the federal stimulus.
Yet the ARRA was not designed to reverse Puerto Rico’s structural decline, which predated the Great Recession and reflected long-term factors such as the phaseout of Section 936 and persistent difficulties in adapting the policy framework to changing economic conditions. With federal stimulus waning after 2012, growth resumed its downward trajectory—reinforcing the view that short-term, top-down support alone is unlikely to resolve long-standing structural weaknesses.
Puerto Rico’s experience with the ARRA suggests that large-scale countercyclical spending can stabilize output in the short run, but lasting growth is more closely tied to an economy’s capacity to generate productivity gains and private investment. In other words, long-term prosperity hinges on the policy environment and local competitiveness.
ARRA’s legacy, therefore, is twofold: it served as short-run macroeconomic stabilization policy, but it also underscored the limits of such policy in the absence of deeper structural changes. Ongoing and future recovery efforts can build on this experience by pairing federal fiscal support with reforms that expand Puerto Rico’s productive base and support more resilient growth.
Acknowledgements
The author thanks Tere Nolla and Michelle Cuevas for their guidance and supervision throughout the development of this study. The author is also grateful to Mari Carmen Schell for her careful editorial support; to Gustavo Vélez for providing contextual insights on selected economic events that informed the broader analysis; and to Carlos López for the visual design of the paper.
References
American Recovery and Reinvestment Act of 2009, Pub. L. No. 111-5, 123 Stat. 115 (2009). https://www.congress.gov/bill/111th-congress/house-bill/1/text
Berk, J., & Rangarajan, A. (2015). Evaluation of the ARRA COBRA subsidy: Final report. Mathematica Policy Research. https://www.dol.gov/sites/dolgov/files/ebsa/researchers/analysis/health-and-welfare/evaluation-of-the-arra-cobra-subsidy.pdf
Blinder, A. S. (2022). A monetary and fiscal history of the United States, 1961–2021. Princeton University Press.
Bonham, C. (2011, October 27). US economy reaches pre-recession peak. UHERO. https://uhero.hawaii.edu/us-economy-reaches-pre-recession-peak/
Bram, J., Martínez, F. E., & Steindel, C. (2008). Trends and developments in the economy of Puerto Rico. Current Issues in Economics and Finance, 14(2). Federal Reserve Bank of New York. https://www.newyorkfed.org/research/current_issues/ci14-2.html
Capella, G. (2025a). ARRA spending flows: U.S. and Puerto Rico figures, 2009–2013 [Unpublished dataset]. Internal files, Centro CRECE.
Capella, G. (2025b). Puerto Rico annual macroeconomic dataset, 1990–2025 [Unpublished dataset]. Internal files, Centro CRECE.
Capella, G. (2025c). Puerto Rico quarterly macroeconomic dataset, 2000–2025 [Unpublished dataset]. Internal files, Centro CRECE.
Caraballo-Cueto, J., & Lara, J. (2018). Deindustrialization and unsustainable debt in middle-income countries: The case of Puerto Rico. Journal of Globalization and Development, 9(1). https://doi.org/10.1515/jgd-2017-0009
Charles River Associates. (2014). The Commonwealth of Puerto Rico: The next chapter. CRA Insights: Financial Markets. https://www.crai.com/insights-events/publications/commonwealth-puerto-rico-next-chapter/
Congressional Budget Office. (2009). The budget and economic outlook: An update (Publication No. 3262). https://www.cbo.gov/publication/41215
Congressional Budget Office. (2014). Estimated impact of the American Recovery and Reinvestment Act on employment and economic output in 2013. https://www.cbo.gov/publication/45122
Congressional Research Service. (2010). Unemployment insurance provisions in the American Recovery and Reinvestment Act of 2009 (CRS Report R40368). https://www.congress.gov/crs-product/R40368
Daly, M., Hobijn, B., & Valletta, R. (2011). The recent evolution of the natural rate of unemployment [FOMC background memo]. Federal Reserve Bank of San Francisco. https://www.federalreserve.gov/monetarypolicy/files/FOMC20110117memo01.pdf
Enchautegui, M. E. (2014). A work tax credit that supports Puerto Rico’s working families. Urban Institute. https://www.urban.org/research/publication/work-tax-credit-supports-puerto-ricos-working-families
Federal Reserve Bank of St. Louis. (n.d.). Federal Reserve Economic Data (FRED) [Database]. Retrieved September 22, 2025, from https://fred.stlouisfed.org
Feliciano, Z., & Green, A. (2017). U.S. multinationals in Puerto Rico and the repeal of Section 936 tax exemption for U.S. corporations (NBER Working Paper No. 23681). National Bureau of Economic Research. https://www.nber.org/papers/w23681
Gobierno de Puerto Rico. (n.d.-a). ARRA grants details for Puerto Rico, 2009–2013 [Unpublished dataset]. Centro CRECE archives, San Juan, PR.
Gobierno de Puerto Rico. (n.d.-b). ARRA infrastructure projects [Unpublished dataset]. Centro CRECE archives, San Juan, PR.
Gobierno de Puerto Rico, Banco de Desarrollo Económico. (n.d.). Economic Activity Index [Dataset]. Retrieved September 22, 2025, from https://www.bde.pr.gov/BDEPROnline/Home/PRED
Gobierno de Puerto Rico, Departamento de Hacienda. (2009). Financial information and operating data report. https://hacienda.pr.gov/sites/default/files/commonwealthreportdatedmay152009.pdf
Gobierno de Puerto Rico, Departamento de Hacienda. (2010a). Financial information and operating data report. https://hacienda.pr.gov/sites/default/files/commonwealthreportdatedmay12010.pdf
Gobierno de Puerto Rico, Departamento de Hacienda. (2010b). Planilla de contribución sobre ingresos de individuos [Formulario 481, forma corta, año contributivo 2010, Rev. 11.10]. https://hacienda.pr.gov/documentos/2010-planilla-de-contribucion-sobre-ingresos-de-individuos-forma-corta-individual-income-tax-return-short-form
Gobierno de Puerto Rico, Departamento de Hacienda. (2010c). Preguntas generales sobre estímulo federal: Beneficio por Trabajo 2009–2010. https://hacienda.pr.gov/downloads/pdf/Preguntas_Estimulo_Federal_2009-2010.pdf
Gobierno de Puerto Rico, Junta de Reestructuración y Estabilización Fiscal. (2011). Plan integral de estabilización fiscal: Informe final al gobernador y los presidentes de la Asamblea Legislativa de Puerto Rico. https://www.centrocrece.org/wp-content/uploads/2021/11/2011.03.30FiscalJREF_InformeFinalPlanIntegraldeEstabilizacionFiscal2011vFINAL.pdf
Gobierno de Puerto Rico, Oficina de Gerencia y Presupuesto. (n.d.). American Recovery and Reinvestment Act. https://presupuesto.pr.gov/Budget_2012_2013/ExecutiveSummary/Ley%20de%20Reinversion%20y%20Estimulo%20Economico%20Federal.pdf
Grunwald, M. (2012). The new new deal: The hidden story of change in the Obama era. Simon & Schuster.
Internal Revenue Service. (2010, January). Most workers need to file new Schedule M; Making Work Pay Credit offers tax savings up to $800 (Fact Sheet FS-2010-7). https://www.irs.gov/pub/irs-news/fs-10-07.pdf
Internal Revenue Service. (2010, January). Most workers need to file new Schedule M; Making Work Pay Credit offers tax savings up to $800 (Fact Sheet FS-2010-7). https://www.irs.gov/pub/irs-news/fs-10-07.pdf
Ley del Plan de Estímulo Económico Criollo, Ley Núm. 9-2009 (2009) (según enmendada). https://bvirtualogp.pr.gov/ogp/Bvirtual/leyesreferencia/PDF/9-2009.pdf
Lucas, R. E., Jr., & Sargent, T. J. (1978). After Keynesian macroeconomics. In After the Phillips curve: Persistence of high inflation and high unemployment (Conference Series No. 19, pp. 49–72). Federal Reserve Bank of Boston. https://www.bostonfed.org/-/media/Documents/conference/19/conf19d.pdf
Medicaid and CHIP Payment and Access Commission. (2019). Mandated report: Medicaid in Puerto Rico. In Report to Congress on Medicaid and CHIP (pp. 74–101). https://www.macpac.gov/wp-content/uploads/2019/06/Mandated-Report-Medicaid-in-Puerto-Rico.pdf
Office of Management and Budget. (2009, June 22). Implementing guidance for the reports on use of funds pursuant to the American Recovery and Reinvestment Act of 2009 (M-09-21). https://www.whitehouse.gov/wp-content/uploads/legacy_drupal_files/omb/memoranda/2009/m09-21.pdf
Peterson, A., Johnson, B., Moulton, B. E., Smith, E. O., Suchman, A., Wilson, C., Francisquini, S., Kauff, J., Ladinsky, J., & Castner, L. (2010). Implementing SNAP in Puerto Rico: A feasibility study. U.S. Department of Agriculture, Food and Nutrition Service. https://www.fns.usda.gov/research/snap/implementing-snap-in-puerto-rico-feasibility-study
Recovery Accountability and Transparency Board. (2013, August 1). ARRA spending and recipient data [Archived web pages]. Recovery.gov. https://web.archive.org/web/20130801094138/http://www.recovery.gov/pages/default.aspx
Recovery Accountability and Transparency Board. (2014). The American Recovery and Reinvestment Act of 2009: Recipient and agency reported data, 2009–2013.
Santos-Lozada, A. R., Kaneshiro, M., McCarter, C., & Marazzi-Santiago, M. (2020). Puerto Rico exodus: Long-term economic headwinds prove stronger than Hurricane Maria. Population and Environment, 42(1), 43–56. https://link.springer.com/article/10.1007/s11111-020-00355-5
Social Security Administration. (2009). Congressional statistics, December 2008, Puerto Rico. https://www.ssa.gov/policy/docs/factsheets/cong_stats/2008/pr.html
Szymendera, S. (2009). Social Security provisions in the American Recovery and Reinvestment Act of 2009: Supplemental appropriations, economic recovery payments, and tax credits for certain government retirees (CRS Report No. R40188). Congressional Research Service. https://www.everycrsreport.com/reports/R40188.html
Universidad de Puerto Rico, Junta de Síndicos. (2009, July 7). Certificación número 93 (2008–2009), Presupuesto 2009–2010. https://docs.upra.edu/rectoria/pdf/2008-2009_cert_93.pdf
Universidad de Puerto Rico, Junta de Síndicos. (2010, June 28). Certificación número 135 (2009–2010), Presupuesto 2010–2011. https://docs.upra.edu/rectoria/pdf/2009-2010_cert_135.pdf
U.S. Department of Agriculture, Food and Nutrition Service. (n.d.). A short history of SNAP. Retrieved October 15, 2025, from https://www.fns.usda.gov/snap/history
U.S. Department of Commerce, Bureau of Economic Analysis. (2011, August 5). How did the recent GDP revisions change the picture of the 2007–2009 recession? https://www.bea.gov/help/faq/1004
U.S. Department of Education, Office of Inspector General. (2013). Puerto Rico: Final Recovery Act expenditures supplemental report (Final Report ED-OIG/A04M0014). https://www.ed.gov/media/document/a04m0014pdf-90735.pdf
U.S. Department of Education, Office of Inspector General. (2014). Lessons from implementing the American Recovery and Reinvestment Act of 2009 (Final Management Information Report ED-OIG/X09M0002). https://www.ed.gov/media/document/x09m0002pdf-90740.pdf
U.S. Department of Housing and Urban Development, Office of Inspector General. (2009a). The municipality of Río Grande, Puerto Rico, needs to improve administration of its Community Development Block Grant program and its Recovery Act funds (Audit Report No. 2009-AT-1012). https://www.hudoig.gov/reports-publications/report/municipality-rio-grande-puerto-rico-needs-improve-administration-its
U.S. Department of Housing and Urban Development, Office of Inspector General. (2009b). The Puerto Rico Public Housing Administration, San Juan, Puerto Rico, mismanaged its Capital Fund Financing Program and inappropriately obligated $32 million in Recovery Act funds (Audit Report No. 2009-AT-1015). https://www.hudoig.gov/reports-publications/report/puerto-rico-public-housing-administration-mismanaged-its-capital-fund
U.S. Department of Labor, Bureau of Labor Statistics. (2010, January 8). The employment situation—December 2009 (USDL-09-1583) [News release]. https://www.bls.gov/news.release/archives/empsit_01082010.htm
U.S. Department of Labor, Employee Benefits Security Administration. (2022). An employee’s guide to health benefits under COBRA. https://www.dol.gov/sites/dolgov/files/EBSA/about-ebsa/our-activities/resource-center/publications/an-employees-guide-health-benefits-under-cobra.pdf
U.S. Department of Labor, Employment and Training Administration, Office of Unemployment Insurance. (2009). Unemployment Insurance data summary, 4th quarter 2009. https://oui.doleta.gov/unemploy/content/data_stats/datasum09/DataSum_2009_4.pdf
U.S. Department of the Treasury. (1983). The operation and effect of the possessions corporation system of taxation (Fourth Report). https://home.treasury.gov/system/files/131/Report-Possessions-1983.pdf
U.S. Department of the Treasury. (2010). The American Opportunity Tax Credit. https://home.treasury.gov/system/files/131/Report-AOTC-2010.pdf
U.S. Government Accountability Office. (2010a). Recovery Act: Increased Medicaid funds aided enrollment growth, and most states reported taking steps to sustain their programs (GAO-11-58). https://www.gao.gov/products/gao-11-58
U.S. Government Accountability Office. (2010b). Recovery Act: One year later, states’ and localities’ uses of funds and opportunities to strengthen accountability (GAO-10-437). https://www.gao.gov/products/gao-10-437
U.S. Government Accountability Office. (2011). Recovery Act education programs: Funding retained teachers, but Education could more consistently communicate stabilization monitoring issues (GAO-11-804). https://www.gao.gov/products/gao-11-804
World Bank. (n.d.). World development indicators [Database]. Retrieved September 22, 2025, from https://data.worldbank.org
Appendix A. Data Construction Methodology
This appendix documents how the datasets used in this policy paper were assembled, validated, and cleaned. Because ARRA information is fragmented across archived federal portals, oversight audits, and local implementation records, U.S. and Puerto Rico data were compiled from multiple sources and reconciled. Spending figures, as well as program and project identifiers, were collected, cross-validated, and deduplicated to ensure accuracy and internal consistency.
A.1 U.S. ARRA SPENDING DATA
Sources Reviewed: Recovery.gov (RATB, 2013, 2014); agency OIG audits; and GAO reports.
Collection and Validation: Amounts were recorded, cross-validated, and deduplicated, then classified by spending type, award type, sector, program, and coverage period.
Output: “U.S.” worksheet of ARRA Spending Flows: U.S. & Puerto Rico Figures, 2009–2013 (Capella, 2025a).
Amounts are reported in nominal terms.
A.2 PUERTO RICO ARRA FUNDS DATA
Sources Reviewed: Recovery.gov (RATB, 2013, 2014); agency OIG audits; GAO reports; and unpublished local records (Gobierno de Puerto Rico, n.d.-a, n.d.-b).
Collection and Validation: Amounts were recorded, cross-validated, and deduplicated, then classified by spending type, award type, sector, program, and coverage period.
Output: “Puerto Rico” worksheet of ARRA Spending Flows: U.S. & Puerto Rico Figures, 2009–2013 (Capella, 2025a).
Amounts are reported in nominal terms.
A.3 MODEL DATA
Sources Reviewed: World Bank, World Development Indicators (WB, n.d.).
Series Used: GDP (constant 2015 US$) – Puerto Rico; GDP (constant 2015 US$) – United States.
Frequency: Annual.
Sample (Collected): 1990–2025.
Sample (Estimated): 2000–2015.
Retrieval Date: September 22, 2025.
Output: Puerto Rico Annual Macroeconomic Dataset, 1990–2025 (Capella, 2025b).
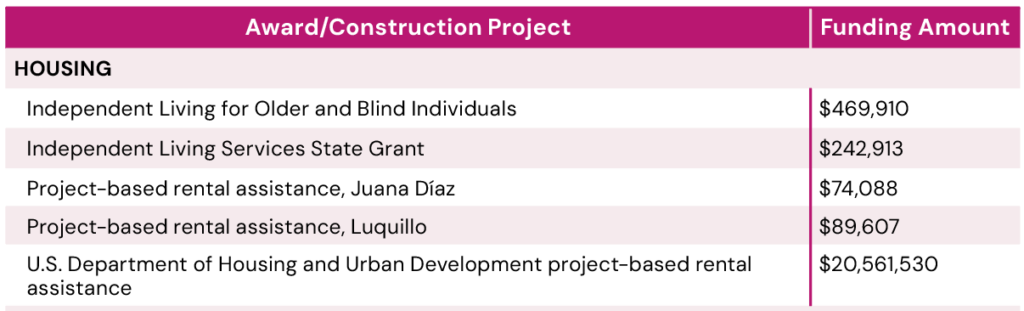
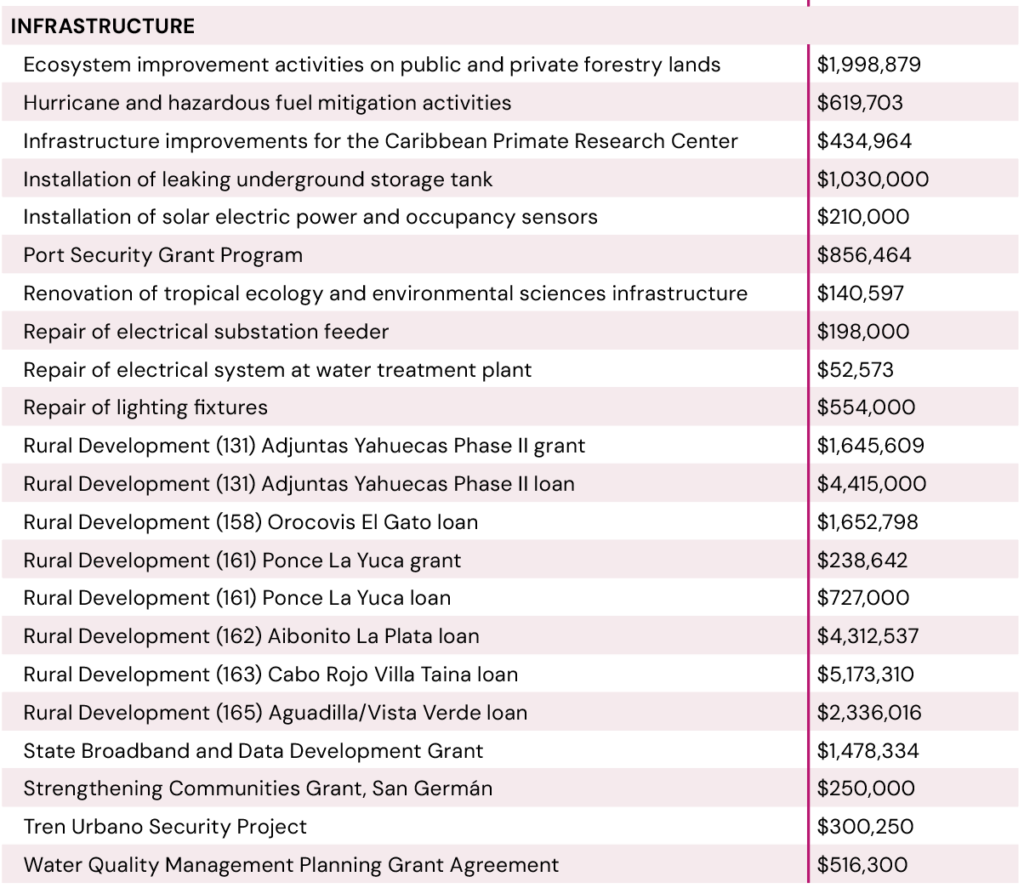
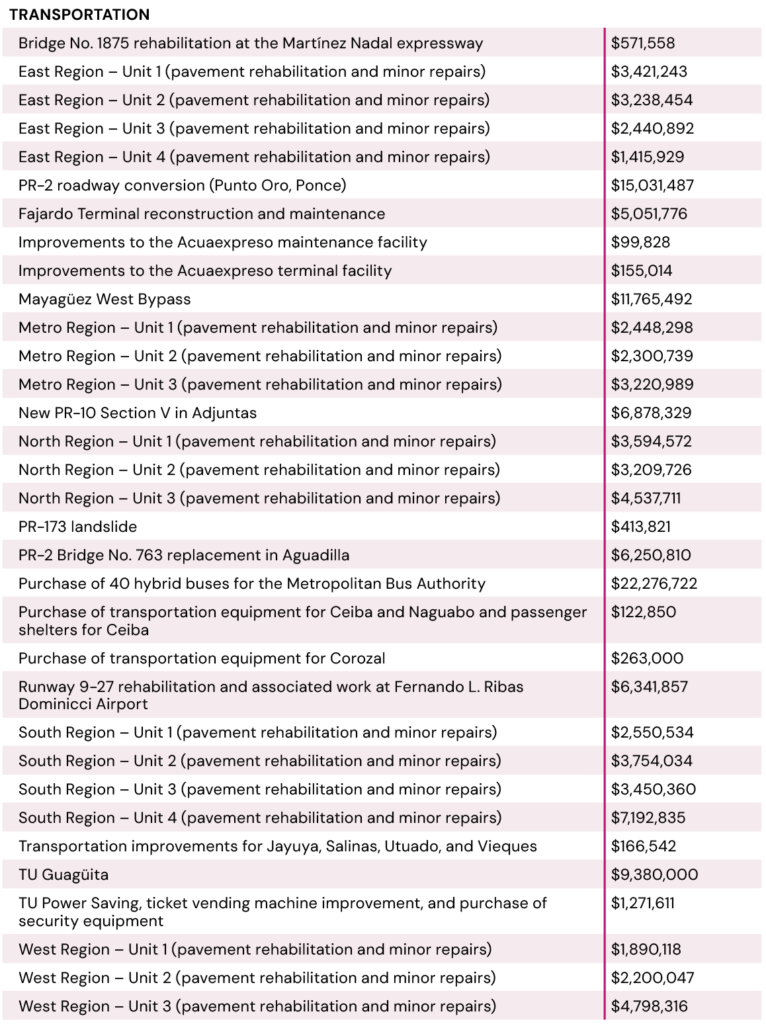
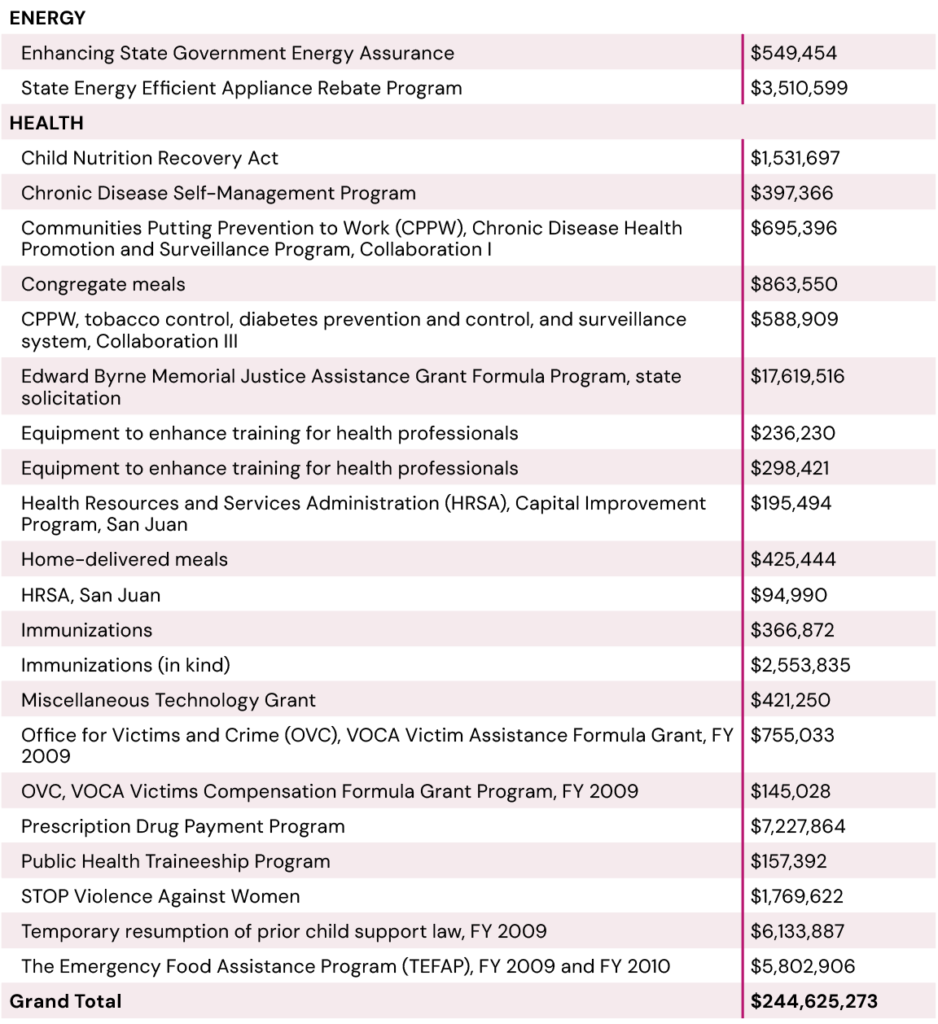
Appendix B. Individual Awards and Construction Projects
This appendix lists the Puerto Rico individual awards and construction projects that underlie the “Other” category in Figure 11.
Table B1. Individual Awards and Construction Projects Underlying “Other” in Figure 11
Source: Unpublished local records.
Appendix C. Supplementary Model Tables, Figures, and Robustness Checks
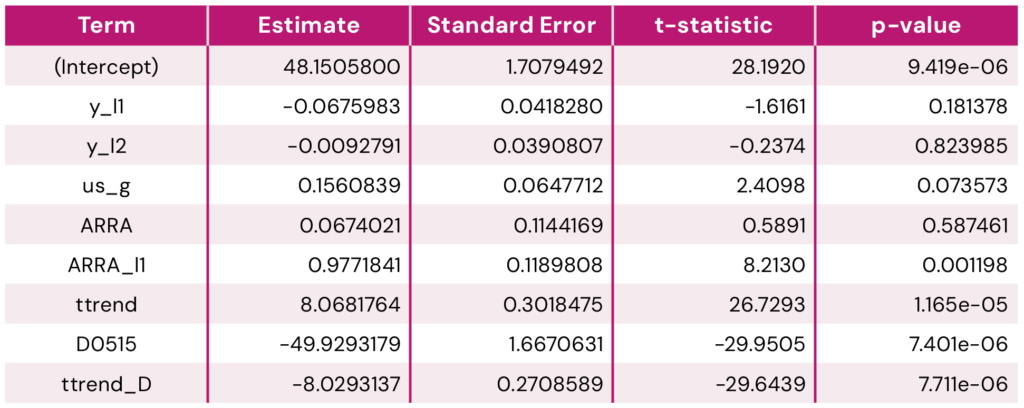
This appendix presents the ITS model specification, coefficient table, and notation-to-code variable mapping, along with a concise set of diagnostics and robustness checks that support the econometric results.6
C.1 MODEL SPECIFICATION, COEFFICIENT TABLE, AND NOTATION-TO-CODE VARIABLE MAPPING
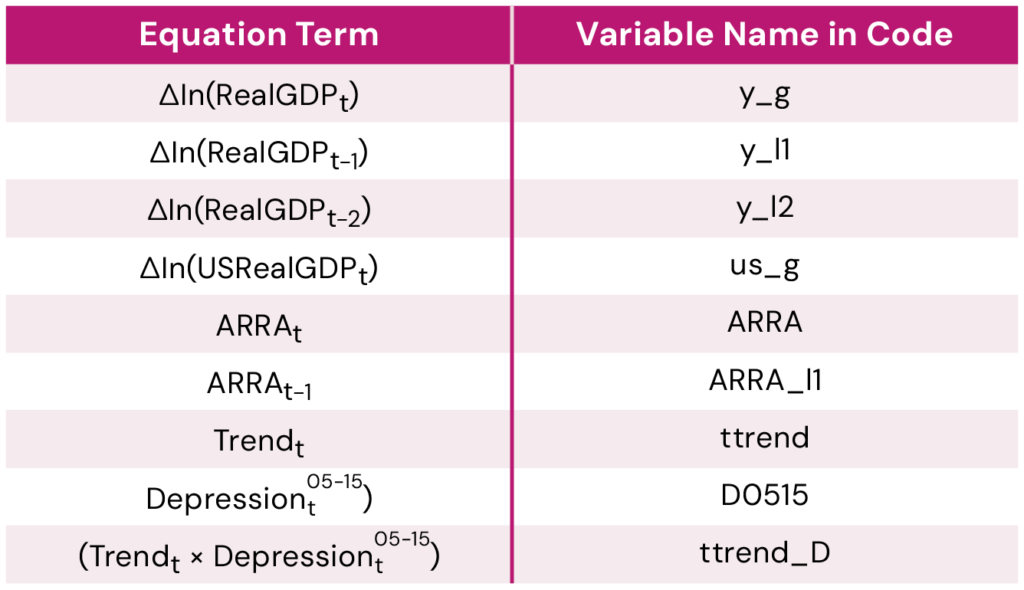
This section outlines the ITS model’s formal specification and reports the estimated coefficients, followed by a mapping between the notation used in the equation and the variable names used in the code.
C.1.1 SPECIFICATION
The full econometric specification used in the ITS model is

where ∆In(RealGDPt) corresponds to the log-difference of Puerto Rico’s real GDP (in constant 2015 USD); ∆In(RealGDPt-1) and ∆In(RealGDPt-2) are one- and two-period lags of the dependent variable; ∆In(USRealGDPt) denotes the log-difference of U.S. real GDP (in constant 2015 USD); ARRAt is a binary variable equal to 1 during 2009–2012 and 0 otherwise and ARRAt-1 is its one-period lag; Trendt is a linear time trend of the log-difference of Puerto Rico’s real GDP; Depressiont05-15 is a binary variable equal to 1 for the period 2005–2015; (Trendt × Depressiont05-15) is an interaction term; and  t is the error term.
C.1.2 COEFFICIENT TABLE
Table C1. Model Coefficients Table
C.1.3 NOTATION-TO-CODE VARIABLE MAPPING
Table C2. Notation-to-Code Variable Mapping
C.2 DIAGNOSTICS
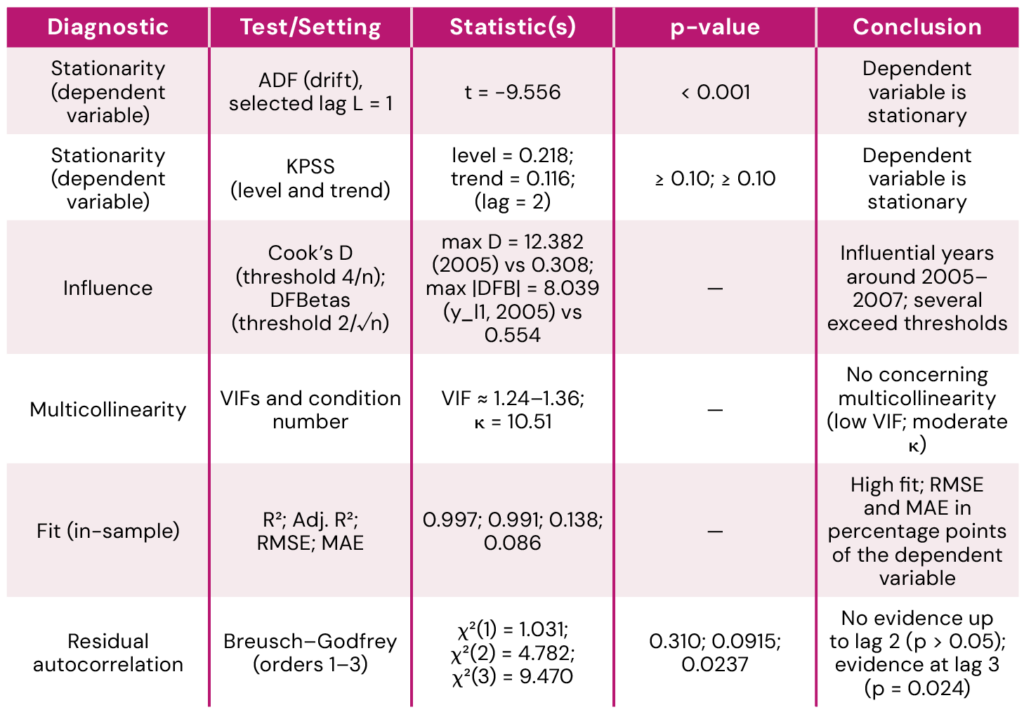
This section summarizes the diagnostic checks applied to the ITS model, including tests of stationarity, influence, multicollinearity, fit, and residual behavior.
C.2.1 DIAGNOSTICS TABLE
Table C3. Diagnostic Tests and Model Performance Summary
C.2.2 RESIDUAL AUTOCORRELATION FUNCTIONS
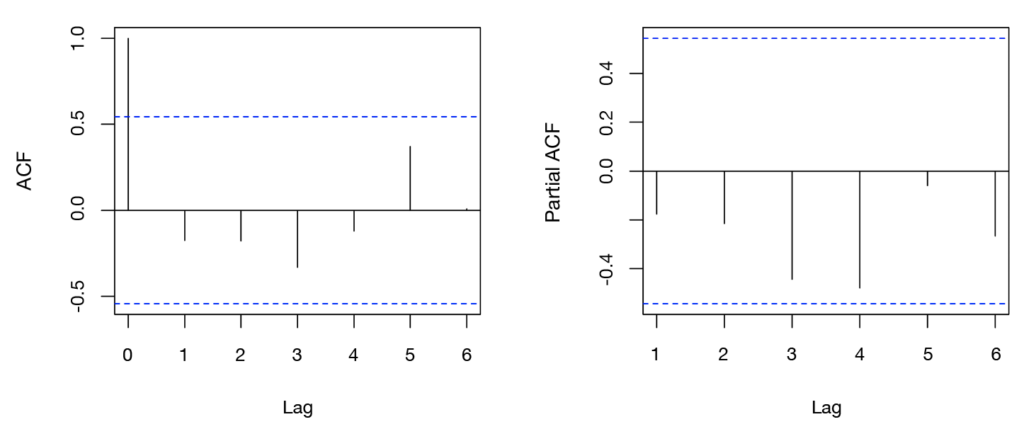
The autocorrelation function and partial autocorrelation function of the ITS model’s residuals are shown here for visualization. Formal tests of residual autocorrelation are reported in Table C3 (Breusch–Godfrey, orders 1–3).
Figure C1. Model Residual Autocorrelation Function (ACF) and Partial ACF (PACF)
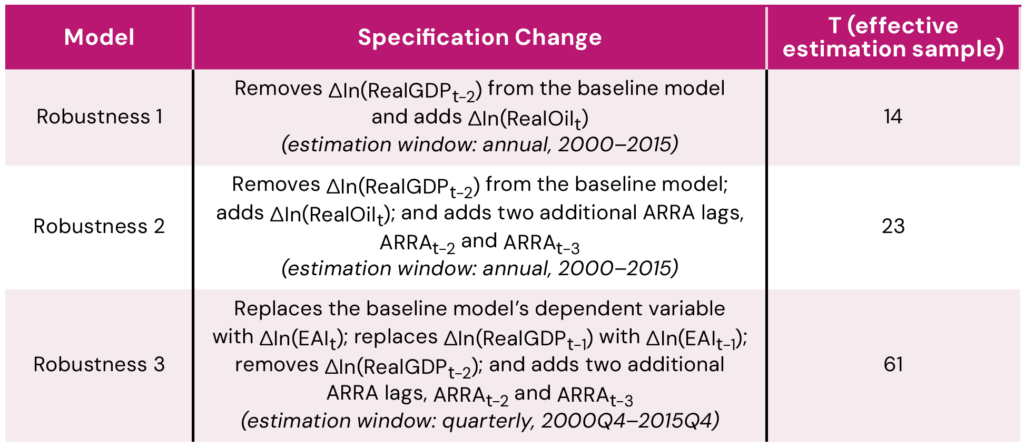
C.3 ROBUSTNESS CHECKS
This section summarizes a set of robustness checks assessing the sensitivity of the ITS model’s results to alternative specifications and variable choices.
C.3.1 SPECIFICATIONS TABLE
Table C4. Robustness Check Specifications and Estimation Samples
C.3.2 COUNTERFACTUAL FIGURES
Figure C2. Puerto Rico Real GDP Growth, With vs. Without ARRA, 2005–2015 (Robustness 1)
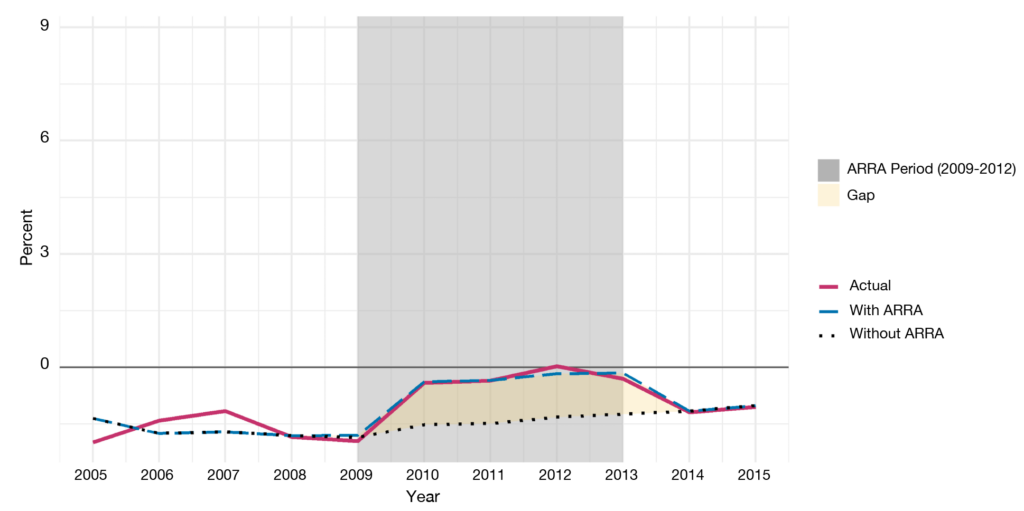
Figure C3. Puerto Rico Real GDP Growth, With vs. Without ARRA, 2005–2015 (Robustness 2)
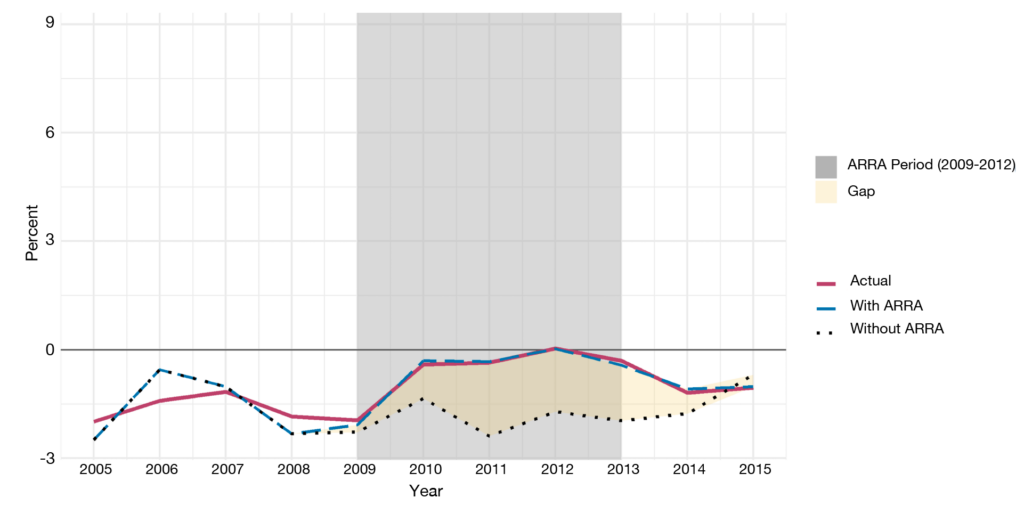
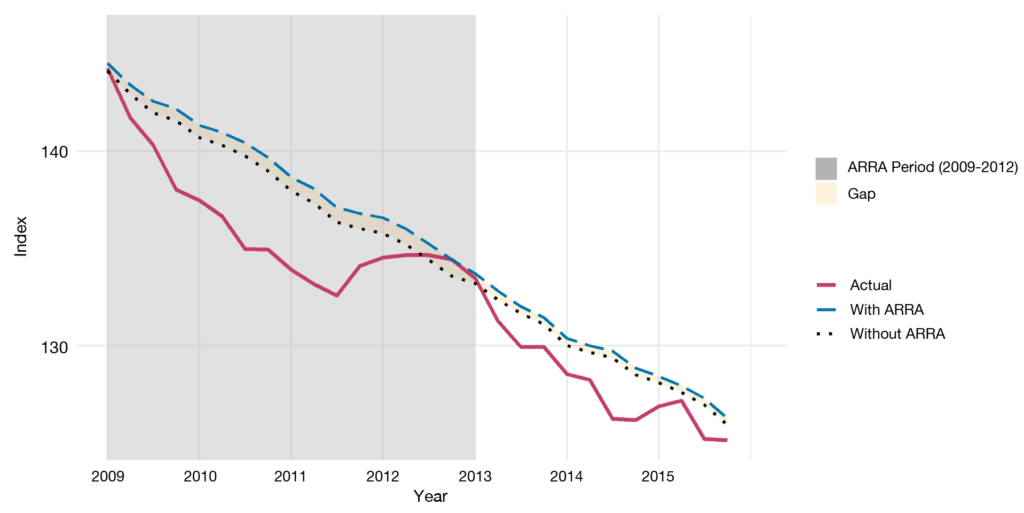
Figure C4. Puerto Rico Economic Activity Index, With vs. Without ARRA, 2009Q1–2015Q4 (Robustness 3)
- All U.S.-level spending data were compiled from Recovery.gov and cross-validated against ARRA implementation reports, including those issued by agency Offices of Inspector General (OIGs) and the Government Accountability Office (GAO). Additional details on data construction methodology are provided in Appendix A.
↩︎ - All Puerto Rico-level spending data were compiled from and cross-validated against Recovery.gov, ARRA implementation reports, and unpublished local records on the administration of funds. Additional details on data construction methodology are provided in Appendix A.
↩︎ - The $120 million allocation to UPR was distributed through a $105 million disbursement in FY 2010 and an additional $15 million in FY 2011. The FY 2010 portion alone accounted for nearly 9 percent of the university’s total budget in that year, at a time when central government contributions were being reduced (UPR, Junta de Síndicos, 2009; UPR, Junta de Síndicos, 2010).
↩︎ - Law No. 8 of 2009 authorized the AFI to oversee Puerto Rico’s implementation of ARRA funds (Gobierno de Puerto Rico, Oficina de Gerencia y Presupuesto, n.d., section “ARRA Implementation Process in Puerto Rico”).
↩︎ - By early 2009, Puerto Rico faced a budget deficit of about $3.3 billion and a projected cash shortfall of roughly $4.5 billion through the end of FY 2009 (Gobierno de Puerto Rico, Departamento de Hacienda, 2009; Junta de Reestructuración y Estabilización Fiscal, 2011). Total public debt stood at approximately $57.5 billion.
↩︎ - All empirical analysis was conducted in R. The coding scripts are available from the author upon request.
↩︎